From agrarian economy to global superpower in half a century—China’s transformation has been an economic success story unlike any other. Today, China is the world’s second largest economy, making up 16% of $86 trillion global GDP in nominal terms. If you adjust numbers for purchasing power parity (PPP), the Chinese economy has already been the world’s largest since 2014. The upward trajectory over the last 70 years has been filled with watershed moments, strategic directives, and shocking tragedies — and all of this can be traced back to the founding of the People’s Republic of China (PRC) on October 1st, 1949.
How the PRC Came to Be
The Chinese Civil War (1927–1949) between the Republic of China (ROC) and the Communist Party of China (CPC) caused a fractal split in the nation’s leadership. The CPC emerged victorious, and mainland China was established as the PRC. Communist leader Mao Zedong set out a few chief goals for the PRC: to overhaul land ownership, to reduce social inequality, and to restore the economy after decades of war. The first State Planning Commission and China’s first 5-year plan were introduced to achieve these goals. Today’s timely chart looks back on seven decades of notable events and policies that helped shape the country China has become. The base data draws from a graphic by Bert Hofman, the World Bank’s Country Director for China and other Asia-Pacific regions.
The Mao Era: 1949–1977
Mao Zedong’s tenure as Chairman of the PRC triggered sweeping changes for the country. 1953–1957: First 5-Year Plan The program’s aim was to boost China’s industrialization. Steel production grew four-fold in four years, from 1.3 million tonnes to 5.2 million tonnes. Agricultural output also rose, but it couldn’t keep pace with industrial production. 1958–1962: Great Leap Forward The campaign emphasized China’s agrarian-to-industrial transformation, via a communal farming system. However, the plan failed—causing an economic breakdown and the deaths of tens of millions in the Great Chinese Famine. 1959–1962: Lushan Conference and 7,000 Cadres meeting Top leaders in the Chinese Communist Party (CCP) met to create detailed policy frameworks for the PRC’s future. 1966–1976: Great Proletarian Cultural Revolution Mao Zedong attempted to regain power and support after the failures of the Great Leap Forward. However, this was another plan that backfired, causing millions more deaths by violence and again crippling the Chinese economy. 1971: Joined the United Nations The PRC replaced the ROC (Taiwan) as a permanent member of the United Nations. This addition also made it one of only five members of the UN Security Council—including the UK, the U.S., France, and Russia. 1972: President Nixon’s visit After 25 years of radio silence, Richard Nixon was the first sitting U.S. President to step foot into the PRC. This helped re-establish diplomatic relations between the two nations. 1976–1977: Mao Zedong Death, and “Two Whatevers” After Mao Zedong’s passing, the interim government promised to “resolutely uphold whatever policy decisions Chairman Mao made, and unswervingly follow whatever instructions Chairman Mao gave.” 1979: “One-Child Policy” The government enacted an aggressive birth-planning program to control the size of the country’s population, which it viewed as growing too fast.
A Wave of Socio-Economic Reforms: 1980-1999
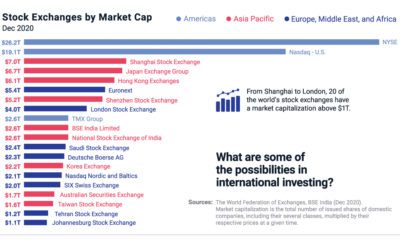
From 1980 onward, China worked on opening up its markets to the outside world, and closing the inequality gap. 1980–1984: Special Economic Zones (SEZs) established Several cities were designated SEZs, and provided with measures such as tax incentives to attract foreign investment. Today, the economies of cities like Shenzhen have grown to rival the GDPs of entire countries. 1981: National Household Responsibility System implemented In the Mao era, quotas were set on how many goods farmers could produce, shifting the responsibility of profits to local managers instead. This rapidly increased the standard of living, and the quota system spread from agriculture into other sectors. 1989: Coastal Development Strategy Post-Mao leadership saw the coastal region as the potential “catalyst” for the entire country’s modernization. 1989–1991: Post-Tiananmen retrenchment Early 1980s economic reforms had mixed results, and the growing anxiety eventually culminated in a series of protests. After tanks rolled into Tiananmen Square in 1989, the government “retrenched” itself by initially attempting to roll back economic reforms and liberalization. The country’s annual growth plunged from 8.6% between 1979-1989 to 6.5% between 1989-1991. 1990–1991: Shanghai and Shenzhen stock exchanges open Combined, the Shanghai (SSE) and Shenzhen (SZSE) stock exchanges are worth over $8.5 trillion in total market capitalization today. 1994: Shandong Huaneng lists on the NYSE The power company was the first PRC enterprise to list on the NYSE. This added a new N-shares group to the existing Chinese capital market options of A-shares, B-shares, and H-shares. 1994–1996: National “8-7” Poverty Reduction Plan China successfully lifted over 400 million poor people out of poverty between 1981 and 2002 through this endeavor. 1996: “Grasp the Large, Let Go of the Small” Efforts were made to downsize the state sector. Policy makers were urged to maintain control over state-owned enterprises to “grasp the large”. Meanwhile, the central government was encouraged to relinquish control over smaller SOEs, or “let go of the small”. 1997: Urban Dibao (低保) China’s social safety net went through restructuring from 1993, and became a nationwide program after strong success in Shanghai. 1997-1999: Hong Kong and Macao handover, Asian Financial Crisis China was largely unscathed by the regional financial crisis, thanks to the RMB (¥) currency’s non-convertibility. Meanwhile, the PRC regained sovereignty of Hong Kong and Macau back from the UK and Portugal, respectively. 1999: Western Development Strategy The “Open Up the West” program built out 6 provinces, 5 autonomous regions, and 1 municipality—each becoming integral to the Chinese economy.
Turn of the Century: 2000-present
China’s entry to the World Trade Organization, and the Qualified Foreign Institutional Investor (QFII) program – which let foreign investors participate in the PRC’s stock exchanges – contributed to the country’s economic growth.
Source: CNBC 2006: Medium-term Plan for Scientific Development The PRC State Council’s 15-year plan outlines that 2.5% or more of national GDP should be devoted to research and development by 2020. 2008-2009: Global Financial Crisis The PRC experienced only a mild economic slowdown during the crisis. The country’s GDP growth in 2007 was a staggering 14.2%, but this dropped to 9.7% and 9.5% respectively in the two years following. 2013: Belt and Road Initiative China’s ambitious plans to develop road, rail, and sea routes across 152 countries is scheduled for completion by 2049—in time for the PRC’s 100th anniversary. More than $900 billion is budgeted for these infrastructure projects. 2015: Made in China 2025 The PRC refuses to be the world’s “factory” any longer. In response, it will invest nearly $300 billion to boost its manufacturing capabilities in high-tech fields like pharmaceuticals, aerospace, and robotics. Despite the recent ongoing trade dispute with the U.S. and an increasingly aging population, the Chinese growth story seems destined to continue on.
China Paving the Way?
The 70th anniversary of the PRC offers a moment to reflect on the country’s journey from humble beginnings to a powerhouse on the world stage. —Bert Hofman, World Bank on Cities—settlements that are densely populated and self-administered—require many specific prerequisites to come into existence. The most crucial, especially for much of human history, is an abundance of food. Surplus food production leads to denser populations and allows for people to specialize in other skills that are not associated with basic human survival. But that also means that cities usually consume more primary goods than they produce. And their size requires a host of many other services—such as transport and sanitation—that are traditionally expensive to maintain. So maintaining large urban centers, and especially the world’s largest cities, was a monumental task. Mapper and history YouTuber Ollie Bye has visualized the seven largest cities in the world since 3,000 BCE. His video covers cities with a minimum population of 10,000 and hints at historical events which led to the establishment, growth, and eventual fall of cities.
The World’s Largest City Throughout History
With any historical data, accuracy is always a concern, and urban populations were rough and infrequent estimates up until the Industrial Revolution. Bye has used a variety of data sources—including the UN and many research papers—to create the dataset used in the video. In some places he also had to rely on his own estimates and criteria to keep the data reasonable and consistent:
In early history, some cities didn’t have given population estimates for long periods of time, and had to be equalized or estimated through other sources. For example, Babylon had a population estimate at 1,600 BCE (60,000) and at 1,200 BCE (75,000) but none in the 400 years between. Cities that only briefly climbed above a population of 10,000, or that would have made the largest cities ranking for only a couple of years (and based on uncertain estimates), were not included.
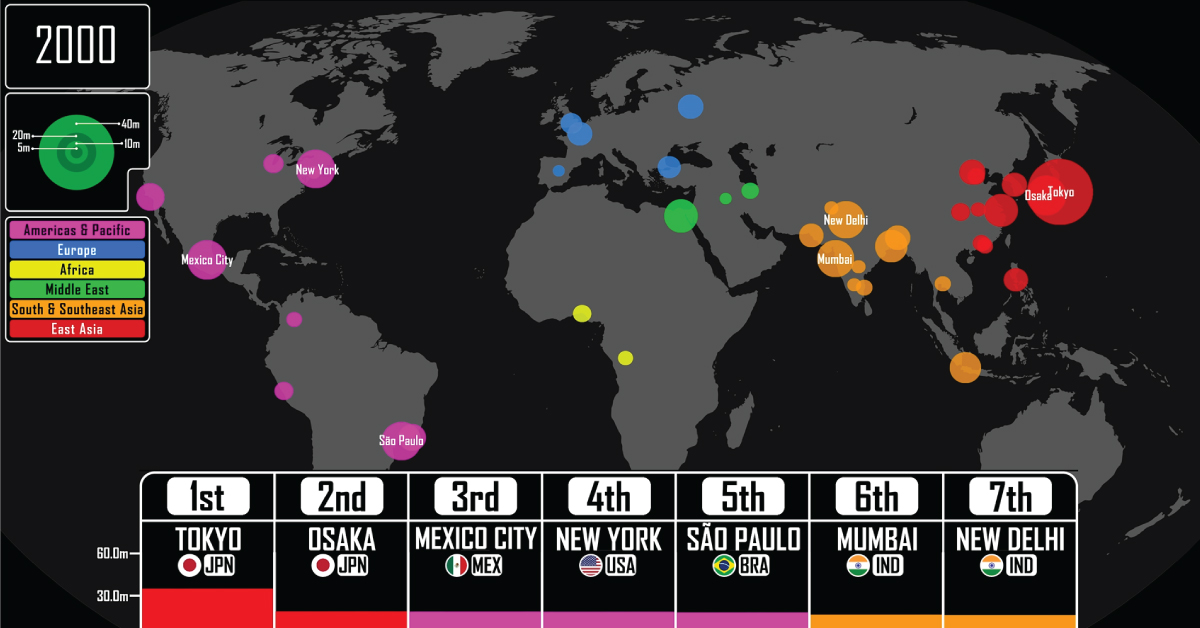
Here’s a look at the largest city starting from the year 3,000 BCE, with populations listed in millions during the last year of each city’s “reign.” Cities are also listed with the flags of current-day countries in the same location.
Ancient Cities in the Fertile Crescent
Considered the “cradle of civilization,” the Fertile Crescent in the Middle East was home to all seven of the largest cities in the world in 3,000 BCE. The Sumerian city of Uruk (modern-day Iraq), allegedly home to the legendary king Gilgamesh, topped the list with 40,000 people. It was followed by Memphis (Egypt) with 20,000 inhabitants. For the next 1,700 years, other Mesopotamian cities in modern-day Iraq and Syria held pole positions, growing steadily and shuffling between themselves as the largest. 2,250 BCE marked the first time a different Asian city—Mohenjo-Daro (modern-day Pakistan) from the Indus Valley Civilization—found a spot at #4 with 40,000 people. The table below is a quick snapshot of the seven largest cities in the world for from 3,000 BCE to 200 CE. Again, populations are listed in millions. It wasn’t until 1,250 BCE that the top two spots were taken by cities in different regions: Pi-Ramesses (Egypt) and Yin (China), both with more than 100,000 residents. Egyptian cities would continue to be the most populous for the next millennium—briefly interrupted by Carthage and Babylon—until the start of the Common Era. By 30 CE, Alexandria was the largest city in the world, but the top 10 had representatives from the Middle East, Northern Africa, and Asia.
All Roads Lead to Rome
One city in Europe meanwhile, was also beginning to see steady growth—Rome. It took until halfway through the 3rd century C.E. for Rome to become the most populous city, followed closely still by Alexandria (Egypt). Meanwhile in Iraq, Ctesiphon, the capital of the Sasanian empire was growing rapidly. Towards the end of the 3rd century, the Roman empire was divided into two, with Constantinople becoming the new capital for the Eastern half. Consequently, it had outgrown Rome by 353 and become the world’s most populous city, and for the next few centuries would reclaim this title time and time again.
The Largest Cities Reach 1 Million
In the 9th century, Baghdad became the first city to have 1 million residents (though historians also estimate Rome and the Chinese city of Chang’an may have achieved that figure earlier). It would be nearly nine centuries until a city had one million inhabitants again, and Baghdad’s reign didn’t last long. By the 10th century, Bian, the capital of the Northern Song dynasty in China, had become the largest city in the world, with Baghdad suffering from relocations and shifting political power to other cities in the region. From the 12th century onwards, Mongol invasions in the Middle East and Central Asia severely limited population growth in the region. European cities too were ravaged in the 14th century, but by plagues instead of marauders. For the next few hundred years, Cairo (Egypt), Hangzhou (China), and Vijayanagara (India) would top the list until Beijing took (and mostly held onto) the top spot through the 19th century.
Industrial Revolution and Rapid Urbanization
The start of the Industrial Revolution in the UK—spreading to the rest of Europe and later on the U.S.—led to hitherto unseen levels of urban population growth. Factories needed labor, which caused mass emigration from the rural countryside to urban centers of growth. In 1827, London passed Beijing to become the largest city in the world with 1.3 million residents. Over the next 100 years, its population increased nearly 7 times, remaining the most populous city until the end of World War I, by which time it was overtaken by New York. From 1920 to 2022, the world population quadrupled thanks to improvements in farming and healthcare, and cities saw rapid growth as well. The beginning of the 20st century saw the top 10 largest cities in the world in the U.S., Europe, and Japan. By the 21st century however, growth shifted away to other parts of the world and by 2021, the top seven had cities only from Asia and the Americas. Tokyo, which took the top spot in 1954, is the largest city in the world today with a population of 37 million (including the entire metropolitan area). It is followed by New Delhi with 31 million, but by 2028, the UN estimates that positions will switch on the leaderboard and New Delhi will overtake Tokyo.
What Does Population Growth Say About the Past (and Future)?
The rise and fall of cities through the sands of time can give us insight into the trajectory of civilization growth. As civilizations grow, become richer, and reach their zenith, so too do their cities blossom in tandem. For example, of the modern-day seven largest cities in the world, four of them belong to countries with the 10 largest economies in the world. Meanwhile, sudden falls in urban population point to turbulence—political instability, wars, natural disasters, or disease. Most recently Ukraine’s cities are seeing depopulation as residents flee conflict zones, raising the specter of a demographic crisis for the country should the war continue. Thus, tracking the size of urban population can help policymakers forecast future roadblocks to growth, especially when prioritizing sustainable growth for a country.