To uncover the major sectors where these emissions originate, this graphic from Our World in Data pulls the latest data from 2016 courtesy of Climate Watch and the World Resources Institute, when total emissions reached 49.4 billion tonnes of CO₂ equivalents (CO₂e).
Sources of GHG Emissions
Global GHG emissions can be roughly traced back to four broad categories: energy, agriculture, industry, and waste. Overwhelmingly, almost three-quarters of GHG emissions come from our energy consumption. Within each category, there are even more granular breakdowns to consider. We’ll take a closer look at the top two, which collectively account for over 91% of global GHG emissions.
Energy Use
Within this broad category, we can further break things down into sub-categories like transport, buildings, and industry-related energy consumption, to name a few. Billions of people rely on petrol and diesel-powered vehicles to get around. As a result, they contribute to almost 12% of global emissions. But this challenge is also an opportunity: the consumer adoption of electric vehicles (EVs) could significantly help shift the world away from fossil fuel use, both for passenger travel and for freight—although there are still speedbumps to overcome. Meanwhile, buildings contribute 17.5% of energy-related emissions overall—which makes sense when you realize the stunning fact that cities use 60-80% of the world’s annual energy needs. With megacities (home to 10+ million people) ballooning every day to house the growing urban population, these shares may rise even further.
Agriculture, Forestry & Land Use
The second biggest category of emissions is the sector that we rely on daily for the food we eat. Perhaps unsurprisingly, methane from cows and other livestock contribute the most to emissions, at 5.8% total. These foods also have some of the highest carbon footprints, from farm to table. Another important consideration is just how much land our overall farming requirements take up. When significant areas of forest are cleared for grazing and cropland, there’s a clear link between our land use and rising global emissions. Although many of these energy systems are still status quo, the global energy mix is ripe for change. As the data shows, the potential points of disruption have become increasingly clear as the world moves towards a green energy revolution. For a different view on global emissions data, see which countries generate the most CO₂ emissions per capita. on
#1: High Reliability
Nuclear power plants run 24/7 and are the most reliable source of sustainable energy. Nuclear electricity generation remains steady around the clock throughout the day, week, and year. Meanwhile, daily solar generation peaks in the afternoon when electricity demand is usually lower, and wind generation depends on wind speeds.As the use of variable solar and wind power increases globally, nuclear offers a stable and reliable backbone for a clean electricity grid.
#2: Clean Electricity
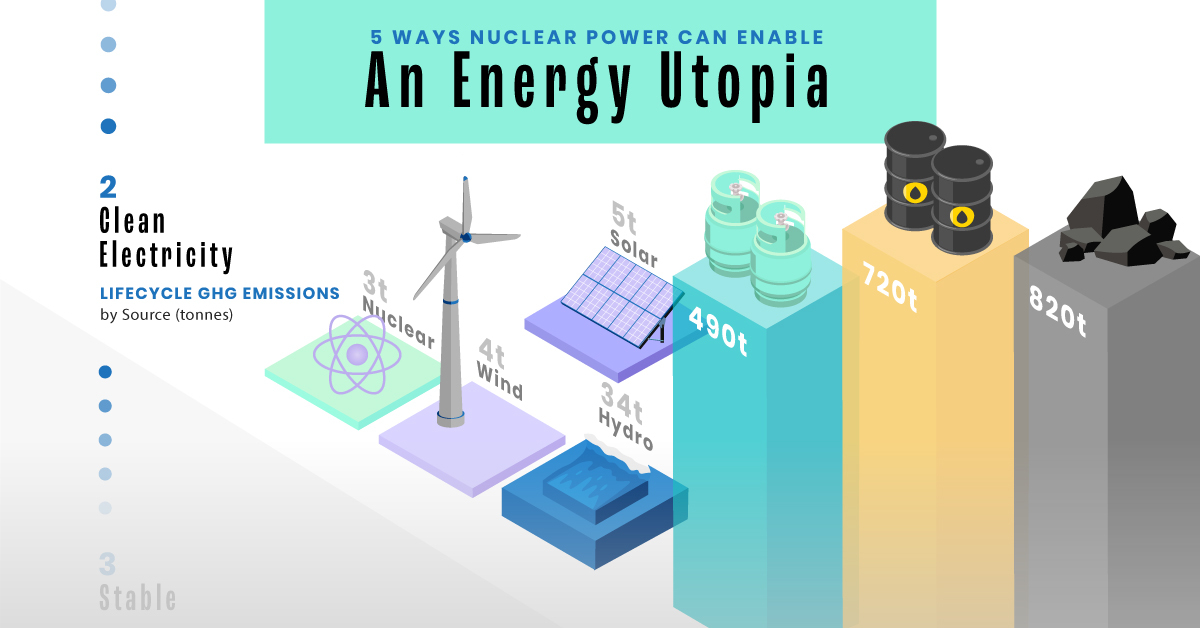
Nuclear reactors use fission to generate electricity without any greenhouse gas (GHG) emissions.Consequently, nuclear power is the cleanest energy source on a lifecycle basis, measured in CO2-equivalent emissions per gigawatt-hour (GWh) of electricity produced by a power plant over its lifetime. The lifecycle emissions from a typical nuclear power plant are 273 times lower than coal and 163 times lower than natural gas. Furthermore, nuclear is relatively less resource-intensive, allowing for lower supply chain emissions than wind and solar plants.
#3: Stable Affordability
Although nuclear plants can be expensive to build, they are cost-competitive in the long run. Most nuclear plants have an initial lifetime of around 40 years, after which they can continue operating with approved lifetime extensions. Nuclear plants with lifetime extensions are the cheapest sources of electricity in the United States, and 88 of the country’s 92 reactors have received approvals for 20-year extensions. Additionally, according to the World Nuclear Association, nuclear plants are relatively less susceptible to fuel price volatility than natural gas plants, allowing for stable costs of electricity generation.
#4: Energy Efficiency
Nuclear’s high energy return on investment (EROI) exemplifies its exceptional efficiency. EROI measures how many units of energy are returned for every unit invested in building and running a power plant, over its lifetime. According to a 2018 study by Weissbach et al., nuclear’s EROI is 75 units, making it the most efficient energy source by some distance, with hydropower ranking second at 35 units.
#5: Sustainable Innovation
New, advanced reactor designs are bypassing many of the difficulties faced by traditional nuclear plants, making nuclear power more accessible.
Small Modular Reactors (SMRs) are much smaller than conventional reactors and are modular—meaning that their components can be transported and assembled in different locations. Microreactors are smaller than SMRs and are designed to provide electricity in remote and small market areas. They can also serve as backup power sources during emergencies.
These reactor designs offer several advantages, including lower initial capital costs, portability, and increased scalability.
A Nuclear-Powered Future
Nuclear power is making a remarkable comeback as countries work to achieve climate goals and ultimately, a state of energy utopia. Besides the 423 reactors in operation worldwide, another 56 reactors are under construction, and at least 69 more are planned for construction. Some nations, like Japan, have also reversed their attitudes toward nuclear power, embracing it as a clean and reliable energy source for the future. CanAlaska is a leading exploration company in the Athabasca Basin, the Earth’s richest uranium depository. Click here to learn more now. In part 3 of the Road to Energy Utopia series, we explore the unique properties of uranium, the fuel that powers nuclear reactors.


