Today’s infographic from Alan’s Factory Outlet visualizes some of the most impressive feats of construction and engineering in a historical timeline of the world’s tallest structures.
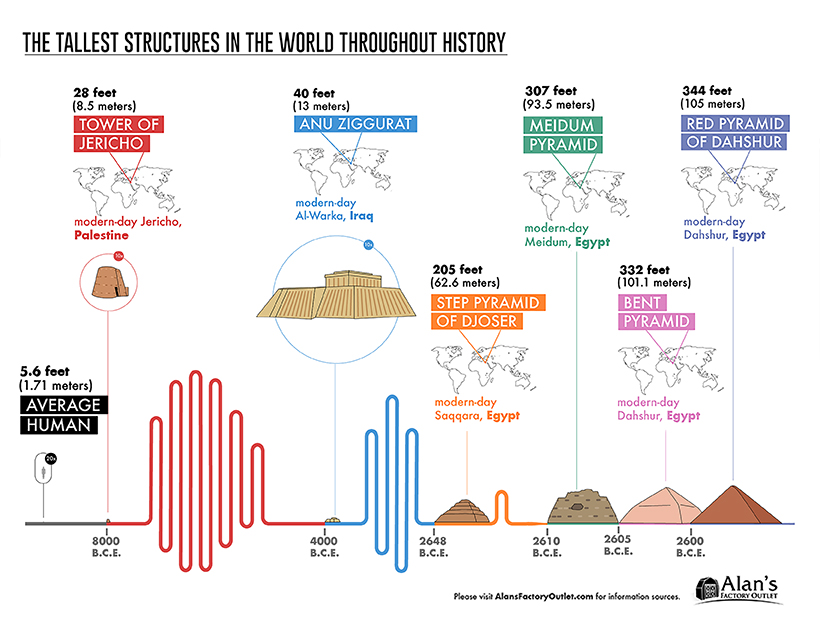
The Stone Age: 8000 — 2570 BCE
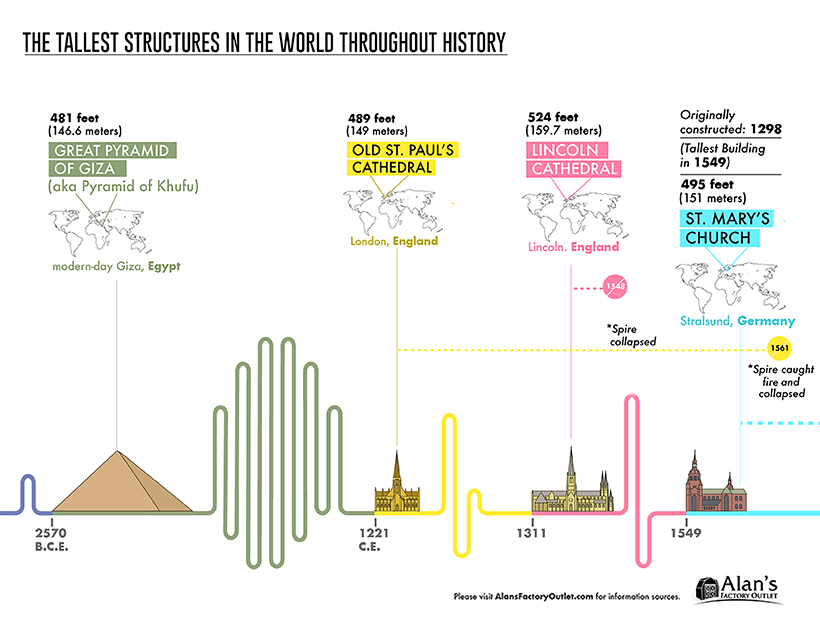
We’ll begin with one of humanity’s earliest stone monuments. Experts estimate that the Tower of Jericho in modern-day Palestine, took 11,000 working days to construct—roughly 30 to 40 years—and is thought to have served as flood protection, and to mark the summer solstice. According to some archaeologists, it also inspired awe to “motivate people [into] a communal lifestyle”. View the full timeline by clicking here. The next significant structure was built nearly 4,000 years later. The Anu Ziggurat (White Temple) is located in Uruk, the ancient city of Sumer. Towering over the city’s defensive walls and visible from afar, it symbolized the city’s political power at the time. Egypt’s era of pyramids was ushered in with the Step Pyramid of Djoser. A few decades later, the founding pharaoh Sneferu is credited for the vision behind the three major Egyptian pyramids—the Meidum, Bent, and Red Pyramids of Dahshur. The different designs reflect both the engineering shortfalls and advancements experienced during their construction…eventually leading to the most monumental pyramid of all. The Great Pyramid of Giza is the oldest of the ancient world wonders, and the only one that is still intact today. It weighs an estimated 6 million tonnes—and rising up at 481 feet (147 meters), it was unsurpassed as the tallest structure for thousands of years.
Cathedral Creation: 1221 — 1549 CE
The timeline below skips ahead over 3,000 years after the construction of the Great Pyramid, as the reign of cathedrals begins to take over, starting with the Old St. Paul’s Cathedral in 1221—which needed over 200 years to complete. View the full timeline by clicking here. The Lincoln Cathedral enjoyed its title of tallest structure for over 200 years, until the St. Mary’s Church in Germany was constructed. However, all three of these cathedrals suffered serious damage for some reason or another: towers or spires collapsed, the buildings caught on fire, or were struck by lightning.
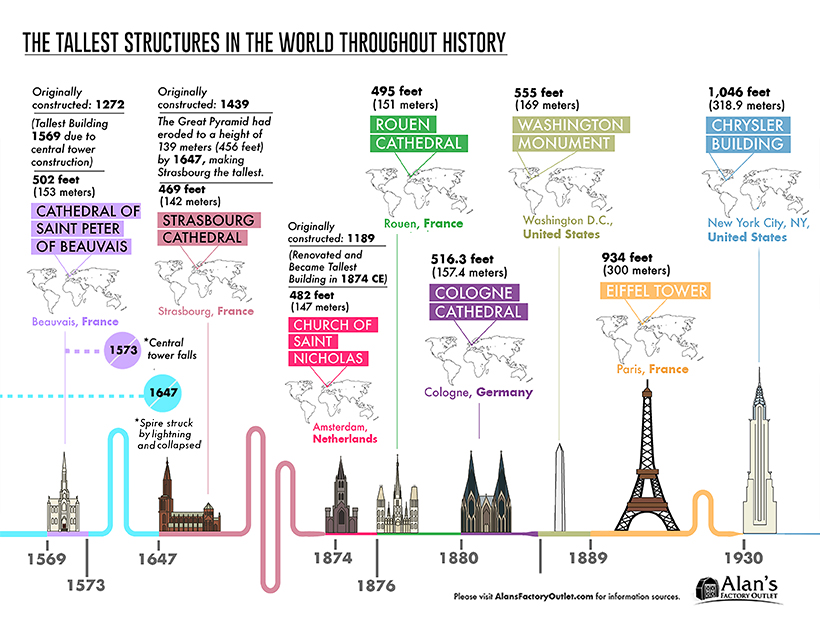
From Churches to the Chrysler: 1569 — 1930
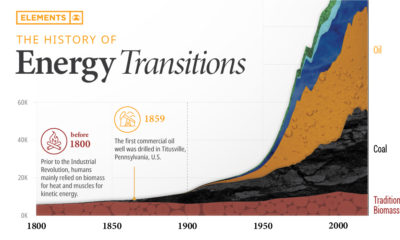
The construction of religious monuments continued well into the late 19th century, with the Cathedral of Saint Peter of Beauvais to the Cologne cathedral. Several cathedrals were originally constructed years prior, but only gained the title of tallest structure once the Great Pyramid had significantly eroded by about 33 feet (10 meters). View the full timeline by clicking here. The Washington Monument, the world’s tallest obelisk, was created in memoriam of the first U.S. President. Though the majority of the Monument is marble, its apex is aluminum and bears several inscriptions on each face. The Eiffel Tower likely needs no introduction—the Parisian cultural icon became the tallest in the world in 1889. The wrought-iron lattice structure costed close to 8 million gold Francs, or US$1.5 million to build. Finally, the Chrysler Building’s art-deco architectural style drew criticism and rave reviews in equal measure. Born out of a skyscraper boom in New York City, it was the first to rise above 1,000 feet—toppling the Eiffel Tower’s tallest title in 1930.
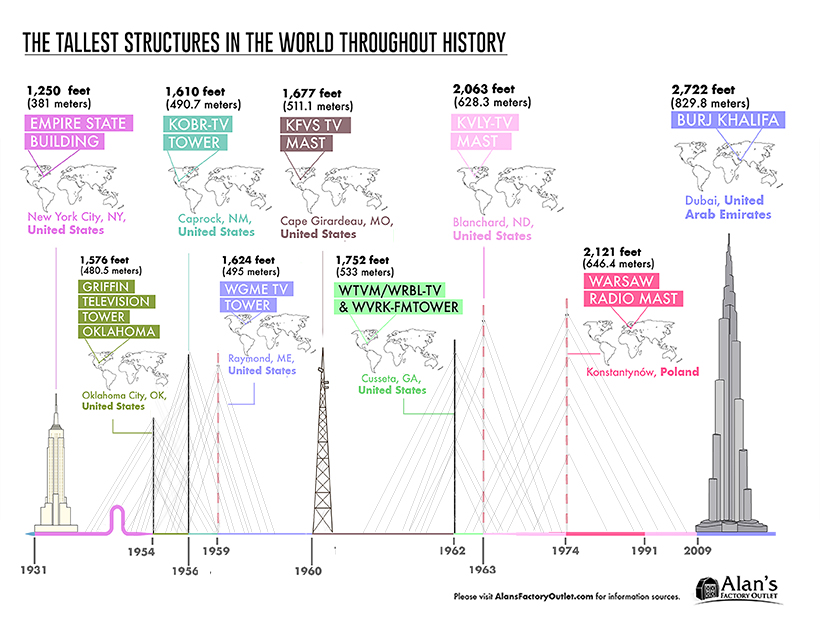
Bigger, Better, Glitzier: 1931 — Present
The “race for the sky” continues with the Empire State Building, an essential contribution to the classic New York City skyline—which cements its place as one of the seven wonders of the modern world. View the full timeline by clicking here. Between 1954 and 1991, the tallest man-made constructions were all TV towers, mostly located across the United States, and the Warsaw Radio Mast in Poland. That’s not to say there was a gap in skyscrapers during this time—in fact, it was quite the opposite all around the world. Saving the best for last, the Burj Khalifa was completed in five years and costed a whopping $1.5 billion. At an impressive 163 floors (2,722 feet or 830 meters), Dubai’s incredible achievement shatters all world records for tallest structures—coming in at nearly 100 times higher than the Tower of Jericho, where this visual timeline first began. on Cities—settlements that are densely populated and self-administered—require many specific prerequisites to come into existence. The most crucial, especially for much of human history, is an abundance of food. Surplus food production leads to denser populations and allows for people to specialize in other skills that are not associated with basic human survival. But that also means that cities usually consume more primary goods than they produce. And their size requires a host of many other services—such as transport and sanitation—that are traditionally expensive to maintain. So maintaining large urban centers, and especially the world’s largest cities, was a monumental task. Mapper and history YouTuber Ollie Bye has visualized the seven largest cities in the world since 3,000 BCE. His video covers cities with a minimum population of 10,000 and hints at historical events which led to the establishment, growth, and eventual fall of cities.
The World’s Largest City Throughout History
With any historical data, accuracy is always a concern, and urban populations were rough and infrequent estimates up until the Industrial Revolution. Bye has used a variety of data sources—including the UN and many research papers—to create the dataset used in the video. In some places he also had to rely on his own estimates and criteria to keep the data reasonable and consistent:
In early history, some cities didn’t have given population estimates for long periods of time, and had to be equalized or estimated through other sources. For example, Babylon had a population estimate at 1,600 BCE (60,000) and at 1,200 BCE (75,000) but none in the 400 years between. Cities that only briefly climbed above a population of 10,000, or that would have made the largest cities ranking for only a couple of years (and based on uncertain estimates), were not included.
Here’s a look at the largest city starting from the year 3,000 BCE, with populations listed in millions during the last year of each city’s “reign.” Cities are also listed with the flags of current-day countries in the same location.
Ancient Cities in the Fertile Crescent
Considered the “cradle of civilization,” the Fertile Crescent in the Middle East was home to all seven of the largest cities in the world in 3,000 BCE. The Sumerian city of Uruk (modern-day Iraq), allegedly home to the legendary king Gilgamesh, topped the list with 40,000 people. It was followed by Memphis (Egypt) with 20,000 inhabitants. For the next 1,700 years, other Mesopotamian cities in modern-day Iraq and Syria held pole positions, growing steadily and shuffling between themselves as the largest. 2,250 BCE marked the first time a different Asian city—Mohenjo-Daro (modern-day Pakistan) from the Indus Valley Civilization—found a spot at #4 with 40,000 people. The table below is a quick snapshot of the seven largest cities in the world for from 3,000 BCE to 200 CE. Again, populations are listed in millions. It wasn’t until 1,250 BCE that the top two spots were taken by cities in different regions: Pi-Ramesses (Egypt) and Yin (China), both with more than 100,000 residents. Egyptian cities would continue to be the most populous for the next millennium—briefly interrupted by Carthage and Babylon—until the start of the Common Era. By 30 CE, Alexandria was the largest city in the world, but the top 10 had representatives from the Middle East, Northern Africa, and Asia.
All Roads Lead to Rome
One city in Europe meanwhile, was also beginning to see steady growth—Rome. It took until halfway through the 3rd century C.E. for Rome to become the most populous city, followed closely still by Alexandria (Egypt). Meanwhile in Iraq, Ctesiphon, the capital of the Sasanian empire was growing rapidly. Towards the end of the 3rd century, the Roman empire was divided into two, with Constantinople becoming the new capital for the Eastern half. Consequently, it had outgrown Rome by 353 and become the world’s most populous city, and for the next few centuries would reclaim this title time and time again.
The Largest Cities Reach 1 Million
In the 9th century, Baghdad became the first city to have 1 million residents (though historians also estimate Rome and the Chinese city of Chang’an may have achieved that figure earlier). It would be nearly nine centuries until a city had one million inhabitants again, and Baghdad’s reign didn’t last long. By the 10th century, Bian, the capital of the Northern Song dynasty in China, had become the largest city in the world, with Baghdad suffering from relocations and shifting political power to other cities in the region. From the 12th century onwards, Mongol invasions in the Middle East and Central Asia severely limited population growth in the region. European cities too were ravaged in the 14th century, but by plagues instead of marauders. For the next few hundred years, Cairo (Egypt), Hangzhou (China), and Vijayanagara (India) would top the list until Beijing took (and mostly held onto) the top spot through the 19th century.
Industrial Revolution and Rapid Urbanization
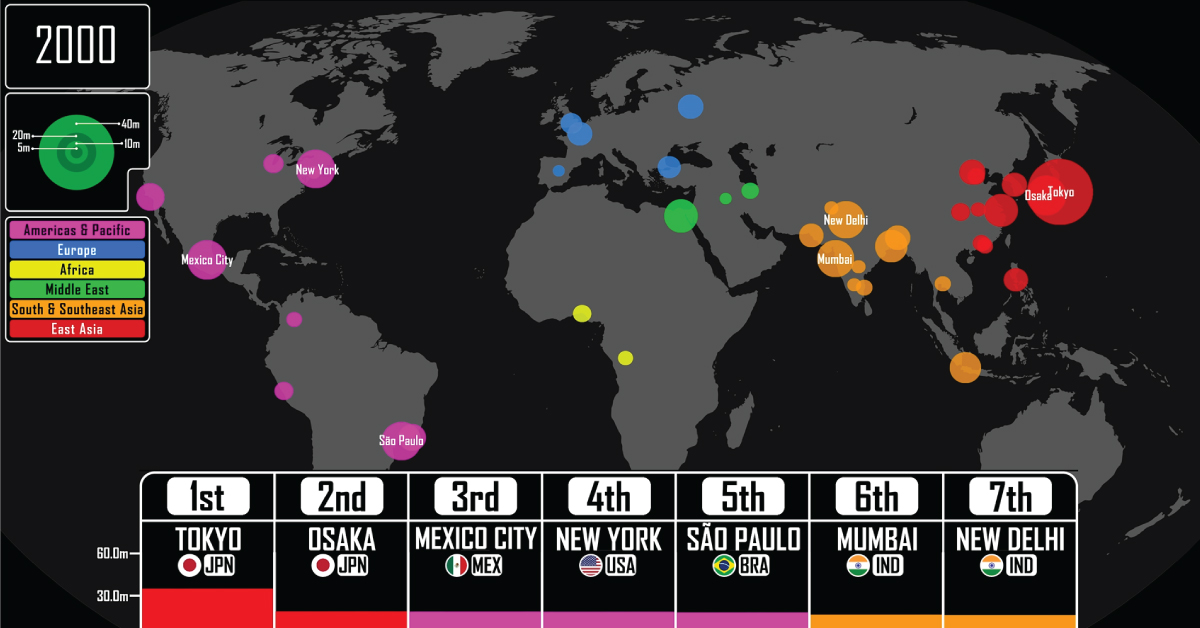
The start of the Industrial Revolution in the UK—spreading to the rest of Europe and later on the U.S.—led to hitherto unseen levels of urban population growth. Factories needed labor, which caused mass emigration from the rural countryside to urban centers of growth. In 1827, London passed Beijing to become the largest city in the world with 1.3 million residents. Over the next 100 years, its population increased nearly 7 times, remaining the most populous city until the end of World War I, by which time it was overtaken by New York. From 1920 to 2022, the world population quadrupled thanks to improvements in farming and healthcare, and cities saw rapid growth as well. The beginning of the 20st century saw the top 10 largest cities in the world in the U.S., Europe, and Japan. By the 21st century however, growth shifted away to other parts of the world and by 2021, the top seven had cities only from Asia and the Americas. Tokyo, which took the top spot in 1954, is the largest city in the world today with a population of 37 million (including the entire metropolitan area). It is followed by New Delhi with 31 million, but by 2028, the UN estimates that positions will switch on the leaderboard and New Delhi will overtake Tokyo.
What Does Population Growth Say About the Past (and Future)?
The rise and fall of cities through the sands of time can give us insight into the trajectory of civilization growth. As civilizations grow, become richer, and reach their zenith, so too do their cities blossom in tandem. For example, of the modern-day seven largest cities in the world, four of them belong to countries with the 10 largest economies in the world. Meanwhile, sudden falls in urban population point to turbulence—political instability, wars, natural disasters, or disease. Most recently Ukraine’s cities are seeing depopulation as residents flee conflict zones, raising the specter of a demographic crisis for the country should the war continue. Thus, tracking the size of urban population can help policymakers forecast future roadblocks to growth, especially when prioritizing sustainable growth for a country.