“If you can’t grow it, you have to mine it” is a famous saying that encapsulates the importance of minerals and metals in the modern world. From every building we enter to every device we use, virtually everything around us contains some amount of metal. The above infographic visualizes all 2.8 billion tonnes of metals mined in 2021 and highlights each metal’s largest end-use using data from the United States Geological Survey (USGS).
Why Do We Mine So Much Iron Ore?
Iron ore accounted for 93% of the metals mined in 2021, with 2.6 billion tonnes extracted from the ground. It’s important to note that this is ore production, which is typically higher than metal production since metals are extracted and refined from ores. For example, the iron metal content of this ore is estimated at 1.6 billion tonnes. With 98% of it converted into pig iron to make steel, iron ore is ubiquitous in our lives. Steel made from iron ore is used in construction, transportation, and household appliances, and it’s likely that you encounter something made out of it every day, especially if you live in a city. Due to its key role in building infrastructure, iron ore is one of the most important materials supporting urbanization and economic growth.
Industrial Metals
Industrial metals are largely used in steelmaking, construction, chemical manufacturing, and as alloying agents. In 2021, the world mined over 181 million tonnes of these metals. *Represents refinery/smelter production. Aluminum accounted for nearly 40% of industrial metal production in 2021. China was by far the largest aluminum producer, making up more than half of global production. The construction industry uses roughly 25% of annually produced aluminum, with 23% going into transportation. Chromium is a lesser-known metal with a key role in making stainless steel stainless. In fact, stainless steel is usually composed of 10% to 30% of chromium, enhancing its strength and corrosion resistance. Copper, manganese, and zinc round out the top five industrial metals mined in 2021, each with its own unique properties and roles in the economy.
Technology and Precious Metals
Technology metals include those that are commonly used in technology and devices. Compared to industrial metals, these are usually mined on a smaller scale and could see faster consumption growth as the world adopts new technologies. *Represents refinery/smelter production. The major use of rhenium, one of the rarest metals in terms of production, is in superalloys that are critical for engine turbine blades in aircraft and gas turbine engines. The petroleum industry uses it in rhenium-platinum catalysts to produce high-octane gasoline for vehicles. In terms of growth, clean energy technology metals stand out. For example, lithium production has more than doubled since 2016 and is set to ride the boom in EV battery manufacturing. Over the same period, global rare earth production more than doubled, driven by the rising demand for magnets. Indium is another interesting metal on this list. Most of it is used to make indium tin oxide, an important component of touchscreens, TV screens, and solar panels.
The Metal Mining Megatrend
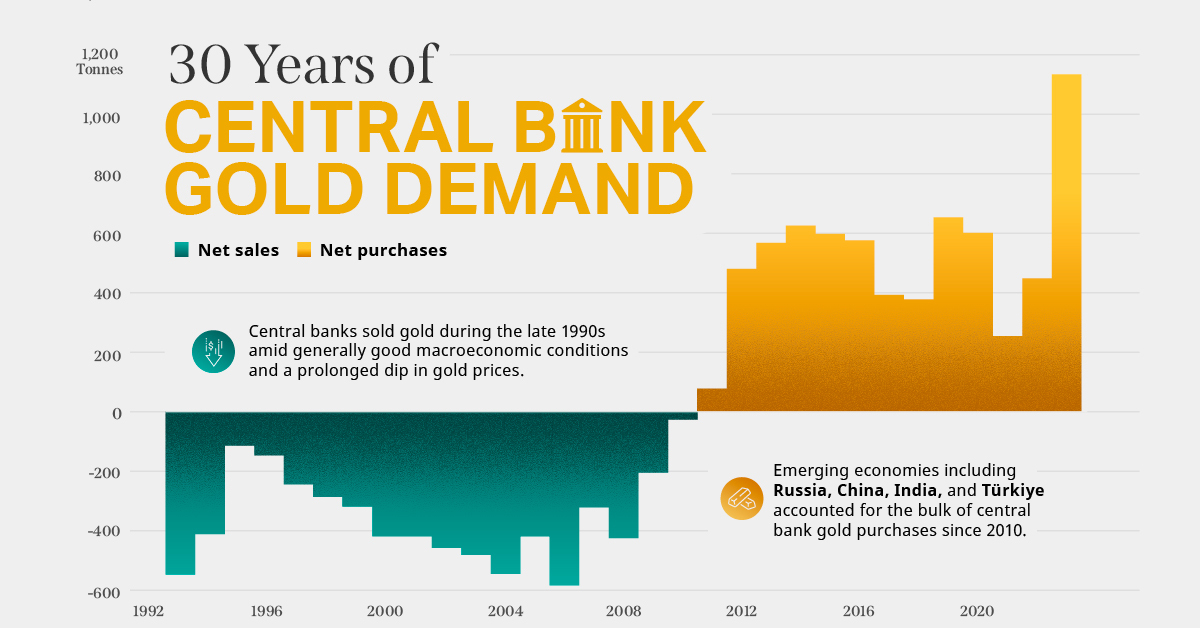
The world’s material consumption has grown significantly over the last few decades, with growing economies and cities demanding more resources. Global production of both iron ore and aluminum has more than tripled relative to the mid-1990s. Other metals, including copper and steel, have also seen significant consumption growth. Today, economies are not only growing and urbanizing but also adopting mineral-intensive clean energy technologies, pointing towards further increases in metal production and consumption. on Did you know that nearly one-fifth of all the gold ever mined is held by central banks? Besides investors and jewelry consumers, central banks are a major source of gold demand. In fact, in 2022, central banks snapped up gold at the fastest pace since 1967. However, the record gold purchases of 2022 are in stark contrast to the 1990s and early 2000s, when central banks were net sellers of gold. The above infographic uses data from the World Gold Council to show 30 years of central bank gold demand, highlighting how official attitudes toward gold have changed in the last 30 years.
Why Do Central Banks Buy Gold?
Gold plays an important role in the financial reserves of numerous nations. Here are three of the reasons why central banks hold gold:
Balancing foreign exchange reserves Central banks have long held gold as part of their reserves to manage risk from currency holdings and to promote stability during economic turmoil. Hedging against fiat currencies Gold offers a hedge against the eroding purchasing power of currencies (mainly the U.S. dollar) due to inflation. Diversifying portfolios Gold has an inverse correlation with the U.S. dollar. When the dollar falls in value, gold prices tend to rise, protecting central banks from volatility. The Switch from Selling to Buying In the 1990s and early 2000s, central banks were net sellers of gold. There were several reasons behind the selling, including good macroeconomic conditions and a downward trend in gold prices. Due to strong economic growth, gold’s safe-haven properties were less valuable, and low returns made it unattractive as an investment. Central bank attitudes toward gold started changing following the 1997 Asian financial crisis and then later, the 2007–08 financial crisis. Since 2010, central banks have been net buyers of gold on an annual basis. Here’s a look at the 10 largest official buyers of gold from the end of 1999 to end of 2021: Rank CountryAmount of Gold Bought (tonnes)% of All Buying #1🇷🇺 Russia 1,88828% #2🇨🇳 China 1,55223% #3🇹🇷 Türkiye 5418% #4🇮🇳 India 3956% #5🇰🇿 Kazakhstan 3455% #6🇺🇿 Uzbekistan 3115% #7🇸🇦 Saudi Arabia 1803% #8🇹🇭 Thailand 1682% #9🇵🇱 Poland1282% #10🇲🇽 Mexico 1152% Total5,62384% Source: IMF The top 10 official buyers of gold between end-1999 and end-2021 represent 84% of all the gold bought by central banks during this period. Russia and China—arguably the United States’ top geopolitical rivals—have been the largest gold buyers over the last two decades. Russia, in particular, accelerated its gold purchases after being hit by Western sanctions following its annexation of Crimea in 2014. Interestingly, the majority of nations on the above list are emerging economies. These countries have likely been stockpiling gold to hedge against financial and geopolitical risks affecting currencies, primarily the U.S. dollar. Meanwhile, European nations including Switzerland, France, Netherlands, and the UK were the largest sellers of gold between 1999 and 2021, under the Central Bank Gold Agreement (CBGA) framework. Which Central Banks Bought Gold in 2022? In 2022, central banks bought a record 1,136 tonnes of gold, worth around $70 billion. Country2022 Gold Purchases (tonnes)% of Total 🇹🇷 Türkiye14813% 🇨🇳 China 625% 🇪🇬 Egypt 474% 🇶🇦 Qatar333% 🇮🇶 Iraq 343% 🇮🇳 India 333% 🇦🇪 UAE 252% 🇰🇬 Kyrgyzstan 61% 🇹🇯 Tajikistan 40.4% 🇪🇨 Ecuador 30.3% 🌍 Unreported 74165% Total1,136100% Türkiye, experiencing 86% year-over-year inflation as of October 2022, was the largest buyer, adding 148 tonnes to its reserves. China continued its gold-buying spree with 62 tonnes added in the months of November and December, amid rising geopolitical tensions with the United States. Overall, emerging markets continued the trend that started in the 2000s, accounting for the bulk of gold purchases. Meanwhile, a significant two-thirds, or 741 tonnes of official gold purchases were unreported in 2022. According to analysts, unreported gold purchases are likely to have come from countries like China and Russia, who are looking to de-dollarize global trade to circumvent Western sanctions.
There were several reasons behind the selling, including good macroeconomic conditions and a downward trend in gold prices. Due to strong economic growth, gold’s safe-haven properties were less valuable, and low returns made it unattractive as an investment.
Central bank attitudes toward gold started changing following the 1997 Asian financial crisis and then later, the 2007–08 financial crisis. Since 2010, central banks have been net buyers of gold on an annual basis.
Here’s a look at the 10 largest official buyers of gold from the end of 1999 to end of 2021:
Source: IMF
The top 10 official buyers of gold between end-1999 and end-2021 represent 84% of all the gold bought by central banks during this period.
Russia and China—arguably the United States’ top geopolitical rivals—have been the largest gold buyers over the last two decades. Russia, in particular, accelerated its gold purchases after being hit by Western sanctions following its annexation of Crimea in 2014.
Interestingly, the majority of nations on the above list are emerging economies. These countries have likely been stockpiling gold to hedge against financial and geopolitical risks affecting currencies, primarily the U.S. dollar.
Meanwhile, European nations including Switzerland, France, Netherlands, and the UK were the largest sellers of gold between 1999 and 2021, under the Central Bank Gold Agreement (CBGA) framework.
Which Central Banks Bought Gold in 2022?
In 2022, central banks bought a record 1,136 tonnes of gold, worth around $70 billion. Türkiye, experiencing 86% year-over-year inflation as of October 2022, was the largest buyer, adding 148 tonnes to its reserves. China continued its gold-buying spree with 62 tonnes added in the months of November and December, amid rising geopolitical tensions with the United States. Overall, emerging markets continued the trend that started in the 2000s, accounting for the bulk of gold purchases. Meanwhile, a significant two-thirds, or 741 tonnes of official gold purchases were unreported in 2022. According to analysts, unreported gold purchases are likely to have come from countries like China and Russia, who are looking to de-dollarize global trade to circumvent Western sanctions.