Today’s chart uses U.S. Census Bureau data to map the percentage of the population that is 65 years or older by state. It also outlines the urban areas that are most heavily skewed towards this older age group.
Proportion of Seniors by State
Below is the full breakdown of the U.S. senior population by state, using the latest available data from 2018. Maine tops the list with 20.6% of its population comprising adults age 65 or older. At the other end of the scale, Utah’s seniors make up only 11.1% of its population. Notably, Florida has the second highest percentage and number of seniors nationwide. Its governor just announced the state’s stay-at-home order on April 1st, after taking criticism for refusing to do so earlier. New York, the current global hot spot of COVID-19, is close to the national average with 16.4% of its population aged 65 or older. However, with over 3.2 million seniors, the sheer volume of individuals needing hospitalization has already put a strain on the state’s healthcare system. Governor Andrew Cuomo says the state will run out of its current supply of ventilators in less than a week.
The Most Vulnerable Urban Areas
On a local level, which places have the highest proportion of seniors? Based on all urban areas* with a population of 250,000 or more, here’s how the top 50 looks: *Urban areas consist of a downtown core and adjacent territories With 6 areas in the top 10, Florida is quite vulnerable at the local level as well. Other states with multiple areas on the list include Ohio, Pennsylvania, and New York.
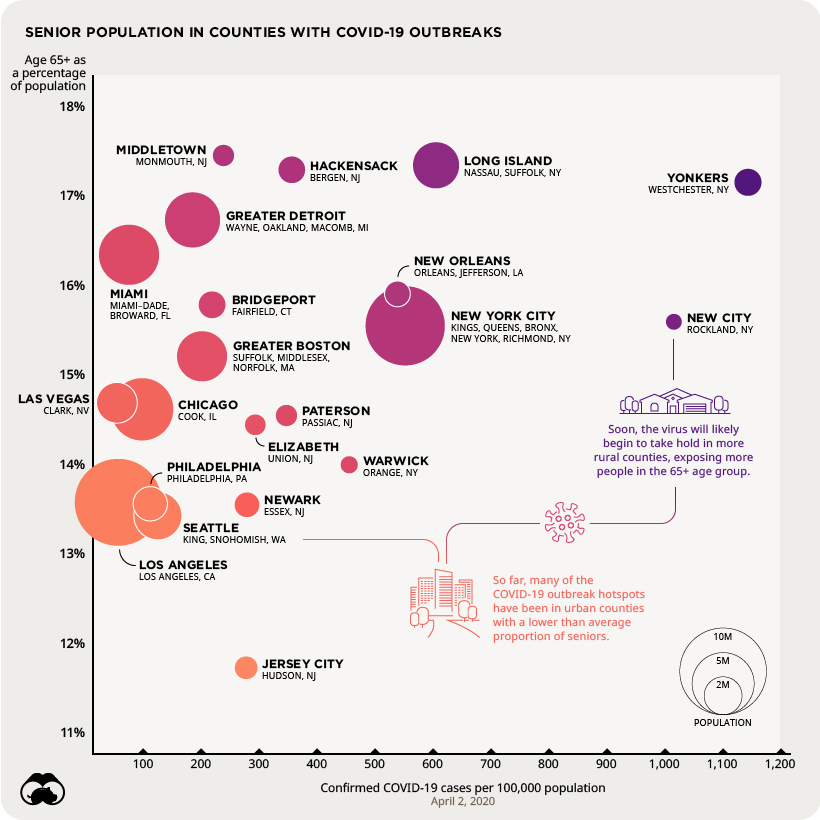
The Senior Population of Current U.S. Hotspots
To determine the vulnerability of current COVID-19 hotspots, we compared U.S. counties with a high number of cases per capita against their percentage of seniors. Counties at the bottom left have low readings on both metrics. Conversely, counties in the top right have a dangerous combination: a high concentration of cases and vulnerable seniors.
Multiple counties in New York occupy the top right quadrant, with Yonkers being the worst off. Los Angeles county, which has a similar population to all counties in New York City, has fewer cases and a smaller proportion of seniors. To date, outbreaks have been mostly focused in urban areas where populations tend to be younger. However, as COVID-19 begins infiltrating rural areas, healthcare systems will need to contend with both older age groups and fewer resources. on Today’s chart measures the extent to which 41 major economies are reopening, by plotting two metrics for each country: the mobility rate and the COVID-19 recovery rate: Data for the first measure comes from Google’s COVID-19 Community Mobility Reports, which relies on aggregated, anonymous location history data from individuals. Note that China does not show up in the graphic as the government bans Google services. COVID-19 recovery rates rely on values from CoronaTracker, using aggregated information from multiple global and governmental databases such as WHO and CDC.
Reopening Economies, One Step at a Time
In general, the higher the mobility rate, the more economic activity this signifies. In most cases, mobility rate also correlates with a higher rate of recovered people in the population. Here’s how these countries fare based on the above metrics. Mobility data as of May 21, 2020 (Latest available). COVID-19 case data as of May 29, 2020. In the main scatterplot visualization, we’ve taken things a step further, assigning these countries into four distinct quadrants:
1. High Mobility, High Recovery
High recovery rates are resulting in lifted restrictions for countries in this quadrant, and people are steadily returning to work. New Zealand has earned praise for its early and effective pandemic response, allowing it to curtail the total number of cases. This has resulted in a 98% recovery rate, the highest of all countries. After almost 50 days of lockdown, the government is recommending a flexible four-day work week to boost the economy back up.
2. High Mobility, Low Recovery
Despite low COVID-19 related recoveries, mobility rates of countries in this quadrant remain higher than average. Some countries have loosened lockdown measures, while others did not have strict measures in place to begin with. Brazil is an interesting case study to consider here. After deferring lockdown decisions to state and local levels, the country is now averaging the highest number of daily cases out of any country. On May 28th, for example, the country had 24,151 new cases and 1,067 new deaths.
3. Low Mobility, High Recovery
Countries in this quadrant are playing it safe, and holding off on reopening their economies until the population has fully recovered. Italy, the once-epicenter for the crisis in Europe is understandably wary of cases rising back up to critical levels. As a result, it has opted to keep its activity to a minimum to try and boost the 65% recovery rate, even as it slowly emerges from over 10 weeks of lockdown.
4. Low Mobility, Low Recovery
Last but not least, people in these countries are cautiously remaining indoors as their governments continue to work on crisis response. With a low 0.05% recovery rate, the United Kingdom has no immediate plans to reopen. A two-week lag time in reporting discharged patients from NHS services may also be contributing to this low number. Although new cases are leveling off, the country has the highest coronavirus-caused death toll across Europe. The U.S. also sits in this quadrant with over 1.7 million cases and counting. Recently, some states have opted to ease restrictions on social and business activity, which could potentially result in case numbers climbing back up. Over in Sweden, a controversial herd immunity strategy meant that the country continued business as usual amid the rest of Europe’s heightened regulations. Sweden’s COVID-19 recovery rate sits at only 13.9%, and the country’s -93% mobility rate implies that people have been taking their own precautions.
COVID-19’s Impact on the Future
It’s important to note that a “second wave” of new cases could upend plans to reopen economies. As countries reckon with these competing risks of health and economic activity, there is no clear answer around the right path to take. COVID-19 is a catalyst for an entirely different future, but interestingly, it’s one that has been in the works for a while. —Carmen Reinhart, incoming Chief Economist for the World Bank Will there be any chance of returning to “normal” as we know it?