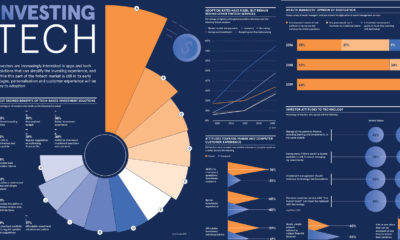
When people begin investing, they see immediate emotional benefits compared to non-investors. In fact, investors are 16 percentage points happier, and 23 percentage points more positive about their well-being. However, only 37% of Brits hold market-based investments. So why aren’t more people taking steps to invest? Today’s infographic from BlackRock outlines the barriers people face, and how wealthtech can help address these issues at scale.
The Wealth Problem
A variety of hurdles keep people from taking control of their finances. All of these factors culminate in insufficient investing. In fact, 50% of the €26 trillion European wealth market is currently in uninvested cash, earning zero interest.
What’s the Current Solution?
Traditionally, investment advisers helped tackle these issues. However, investors have faced challenges accessing professional advice in recent years. A shortage of UK advisers is a main contributing factor:
There are only 26,700 advisers, who can service an average of 100 clients each. This leaves over 51 million adults without professional advice.
Among available advisers, many impose investment minimums or fees that create barriers for lower-income populations. Financial advisers charge an average of £150/hour, and half of all surveyed advisers turned away clients with less than £50,000 to invest. With so many hurdles to overcome, how can Brits take charge of their investments?
A Modern Solution
Wealth technology—or simply wealthtech—helps address these issues at scale, offering four main digital-first solutions: These benefits can be applied across various branches of wealth management.
The Wealthtech Ecosystem
Investors can choose one of three main paths, based on their level of knowledge and interest. “Do It Yourself” Investing Confident investors who enjoy managing their own money can trade securities through self-directed online platforms. “Do It For Me” Investing Novice investors can use platforms that execute trades on their behalf, such as micro-investing or robo-advisers. “Do It With Me” Investing For investors in the middle of this spectrum, certain platforms offer a hybrid of digital transactions and professional advice. With a wide variety of solutions available, investing has never been easier.
Inclusive Wealth-Building
It’s clear Brits are open to the shift: 64% say new technology would help them be more involved in their investments. As wealthtech evolves, it will be seamlessly integrated into daily life as part of a holistic financial services offering. Traditional barriers will be broken down, empowering individuals to take charge of their financial future. on Last year, stock and bond returns tumbled after the Federal Reserve hiked interest rates at the fastest speed in 40 years. It was the first time in decades that both asset classes posted negative annual investment returns in tandem. Over four decades, this has happened 2.4% of the time across any 12-month rolling period. To look at how various stock and bond asset allocations have performed over history—and their broader correlations—the above graphic charts their best, worst, and average returns, using data from Vanguard.
How Has Asset Allocation Impacted Returns?
Based on data between 1926 and 2019, the table below looks at the spectrum of market returns of different asset allocations:
We can see that a portfolio made entirely of stocks returned 10.3% on average, the highest across all asset allocations. Of course, this came with wider return variance, hitting an annual low of -43% and a high of 54%.
A traditional 60/40 portfolio—which has lost its luster in recent years as low interest rates have led to lower bond returns—saw an average historical return of 8.8%. As interest rates have climbed in recent years, this may widen its appeal once again as bond returns may rise.
Meanwhile, a 100% bond portfolio averaged 5.3% in annual returns over the period. Bonds typically serve as a hedge against portfolio losses thanks to their typically negative historical correlation to stocks.
A Closer Look at Historical Correlations
To understand how 2022 was an outlier in terms of asset correlations we can look at the graphic below:
The last time stocks and bonds moved together in a negative direction was in 1969. At the time, inflation was accelerating and the Fed was hiking interest rates to cool rising costs. In fact, historically, when inflation surges, stocks and bonds have often moved in similar directions. Underscoring this divergence is real interest rate volatility. When real interest rates are a driving force in the market, as we have seen in the last year, it hurts both stock and bond returns. This is because higher interest rates can reduce the future cash flows of these investments. Adding another layer is the level of risk appetite among investors. When the economic outlook is uncertain and interest rate volatility is high, investors are more likely to take risk off their portfolios and demand higher returns for taking on higher risk. This can push down equity and bond prices. On the other hand, if the economic outlook is positive, investors may be willing to take on more risk, in turn potentially boosting equity prices.
Current Investment Returns in Context
Today, financial markets are seeing sharp swings as the ripple effects of higher interest rates are sinking in. For investors, historical data provides insight on long-term asset allocation trends. Over the last century, cycles of high interest rates have come and gone. Both equity and bond investment returns have been resilient for investors who stay the course.

