Bubble in Higher Education: When Will It Pop?
The Chart of the Week is a weekly feature in Visual Capitalist on Fridays.
The soaring bull market in higher education has been flying high for some time.
Many factors combined to make it the perfect storm: the demographic rise of the millennials, easy money from the Fed, the “Chivas Regal” effect in pricing strategy that many colleges and universities adopted, and the US government virtually taking over the market for student loans.
It’s a vicious circle as colleges raise prices, students take out easy loans, and the institutions raise prices again. However, it all seems to be coming to a head as several factors begin to show the chinks in the armor.
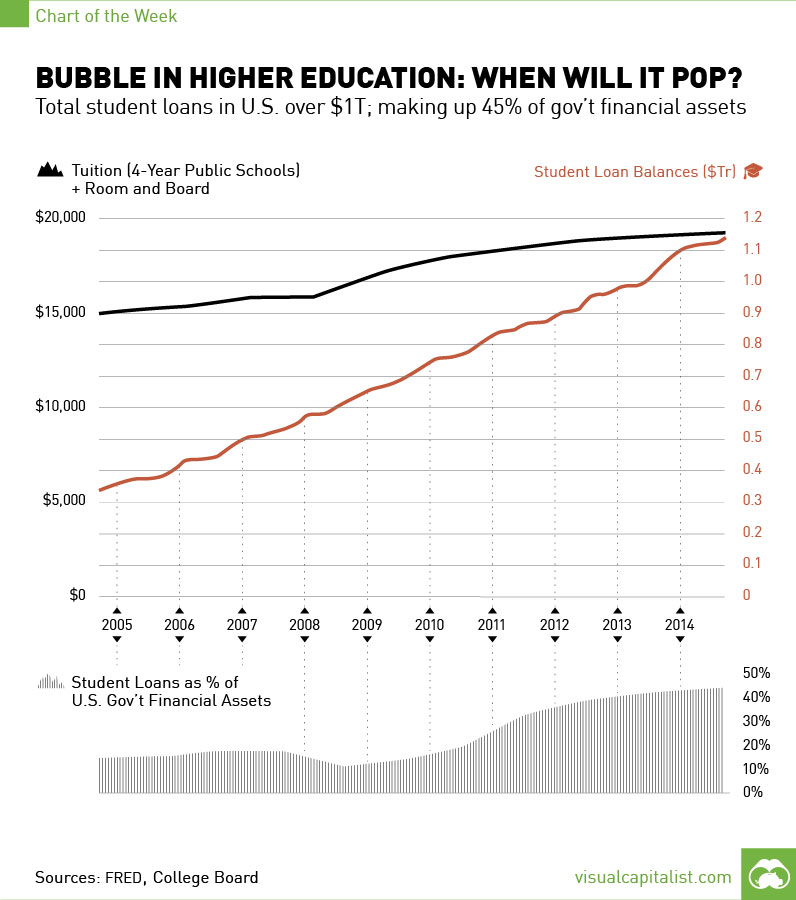
First, the US Federal Government now holds close to 45% of its total financial assets in student debt. This does not include things like land or the any of the Fed’s assets, but it is still extremely significant. Pre-crisis, it was only about one-third of those levels at about 15%.
The main reason for this increase is that the government seems to be the only organization backing student loans. Before the Financial Crisis in 2007, the government only owned $100 billion of student debt – now it owns over $800 billion.
Next, the delinquency rate has risen rapidly over the last decade. Even the St. Louis Federal Reserve branch is becoming concerned with this. In their research article from April 2015, they write: “A delinquency rate of 15 percent for all student loan borrowers implies a delinquency rate of 27.3 percent for borrowers with loans in repayment.”
The problem is that real wages aren’t increasing, and many youth are left unemployed or with low paying jobs. With an average debt load just short of $30,000, it is no wonder that graduates are still struggling.
Lastly, colleges are starting to run into problems making ends meet and often institutions are going bankrupt. Particularly at risk are for-profit colleges with low prestige, as well as liberal arts colleges. Corinthian Colleges agreed to sell or close 107 campuses, leaving 72,000 students in the dust. Sweet Briar College has been in a potential bankruptcy saga for months. Even Louisiana State University is in the middle of drawing up its bankruptcy plan.
In the end, it may be technology may be what truly blindsides schools and students. The cost of an online degree (or even self-education) is a fraction of the cost, and colleges and universities are becoming less relevant every day. Big names such as Peter Thiel and James Altucher have been outspoken skeptics of higher education for years.
This college frat party could be coming to an end soon. The question is: who will end up paying for the kegs?
on Last year, stock and bond returns tumbled after the Federal Reserve hiked interest rates at the fastest speed in 40 years. It was the first time in decades that both asset classes posted negative annual investment returns in tandem. Over four decades, this has happened 2.4% of the time across any 12-month rolling period. To look at how various stock and bond asset allocations have performed over history—and their broader correlations—the above graphic charts their best, worst, and average returns, using data from Vanguard.
How Has Asset Allocation Impacted Returns?
Based on data between 1926 and 2019, the table below looks at the spectrum of market returns of different asset allocations:
We can see that a portfolio made entirely of stocks returned 10.3% on average, the highest across all asset allocations. Of course, this came with wider return variance, hitting an annual low of -43% and a high of 54%.
A traditional 60/40 portfolio—which has lost its luster in recent years as low interest rates have led to lower bond returns—saw an average historical return of 8.8%. As interest rates have climbed in recent years, this may widen its appeal once again as bond returns may rise.
Meanwhile, a 100% bond portfolio averaged 5.3% in annual returns over the period. Bonds typically serve as a hedge against portfolio losses thanks to their typically negative historical correlation to stocks.
A Closer Look at Historical Correlations
To understand how 2022 was an outlier in terms of asset correlations we can look at the graphic below:
The last time stocks and bonds moved together in a negative direction was in 1969. At the time, inflation was accelerating and the Fed was hiking interest rates to cool rising costs. In fact, historically, when inflation surges, stocks and bonds have often moved in similar directions. Underscoring this divergence is real interest rate volatility. When real interest rates are a driving force in the market, as we have seen in the last year, it hurts both stock and bond returns. This is because higher interest rates can reduce the future cash flows of these investments. Adding another layer is the level of risk appetite among investors. When the economic outlook is uncertain and interest rate volatility is high, investors are more likely to take risk off their portfolios and demand higher returns for taking on higher risk. This can push down equity and bond prices. On the other hand, if the economic outlook is positive, investors may be willing to take on more risk, in turn potentially boosting equity prices.
Current Investment Returns in Context
Today, financial markets are seeing sharp swings as the ripple effects of higher interest rates are sinking in. For investors, historical data provides insight on long-term asset allocation trends. Over the last century, cycles of high interest rates have come and gone. Both equity and bond investment returns have been resilient for investors who stay the course.