Millennials Making More Happen With Less [Chart]
Recent survey sheds light on millennial spending habits
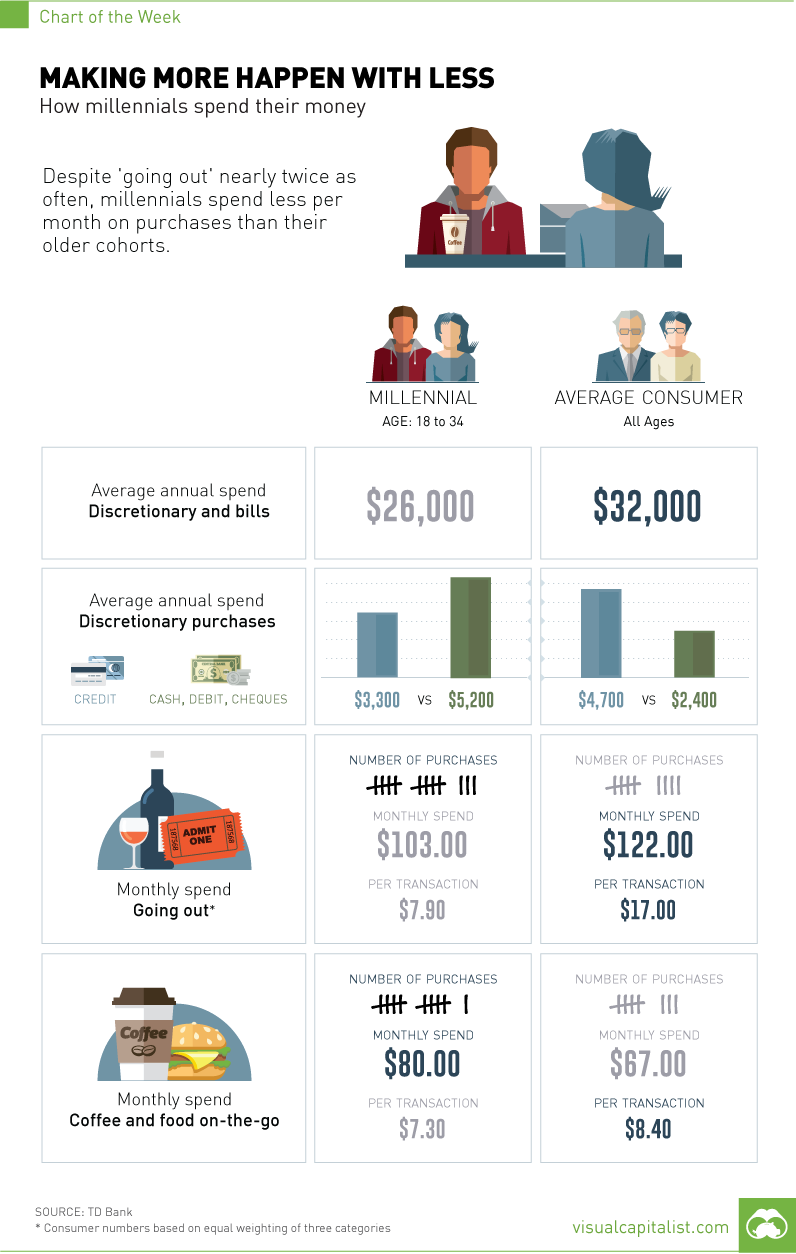
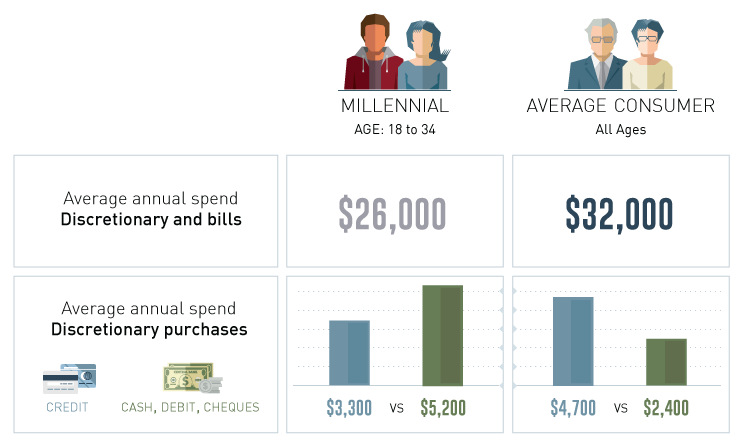
The Chart of the Week is a weekly Visual Capitalist feature on Fridays. Despite the Western world’s general shift towards healthier eating, it may surprise you to learn that McDonald’s shares traded at all-time highs just days ago. How is this possible? Part of the reason is that although millennials will tell you otherwise, the name of the game for courting many millennials is still convenience. Price points at a restaurant such as McDonald’s still have wide appeal to a cash-strapped generation. Based on a recent survey by TD Bank, the convenience trend is still on track. Here’s what we learned on millennial spending habits from the results.
Getting More out of Less
A major finding of the survey was that although millennials “go out” twice as often as Generation X and three times as often as Baby Boomers, they spend less per month on purchases than their older cohorts. The average millennial went out 13 times each month, spending $103 for an average of $7.90 per transaction. This compares with nine trips with $122 of spend ($17 per transaction) for the average consumer. The same was the case for grabbing “coffee and food on-the-go”, where millennials said that they went on more trips than the average consumer. Millennials also spent a higher total than others, spending $80 over 11 trips (compared with $67 over eight for the average consumer).
Experiences vs. Material Items
While the survey paints a picture of millennial thriftiness, we also think that there is another lens that can be used to shed light on the results. In particular, we believe this shows that the value that millennials place on having experiences. To many millennials, “going out” is as much about the experience as the material food itself. Whether it is connecting with old friends at a new thin-crust pizzeria or trying a locally-roasted single-origin coffee with a significant other, it’s often more about sharing an experience with good company. It doesn’t have to be a fancy dinner or involve a $100 bottle of wine purchase to count as quality time. This could be a partial reason behind a higher frequency of trips out, even though less money gets spent overall.
Cash vs. Credit
A final point of interest from the survey lies in the difference in how millennials make discretionary purchases. Millennials, many of whom grew up during the Financial Crisis, are more averse to debt. This is corroborated by the results of a different survey showing that seven out of 10 millennials say they would prefer to use a debit card, rather than a credit card, for their purchases. It’s also an attitude that we’ve covered in a previous chart of the week, where we showed that only 37% of millennials were confident in managing their credit, while 70% of millennials hold their savings and investments in cash.
on To see how the minimum wage differs around the world, we’ve visualized data from Picodi, which includes values for 67 countries as of January 2023.
Monthly Minimum Wage, by Country
The following table includes all of the data used in this infographic. Each value represents the monthly minimum wage a full-time worker would receive in each country. Picodi states that these figures are net of taxes and have been converted to USD. Generally speaking, developed countries have a higher cost of living, and thus require a higher minimum wage. Two outliers in this dataset are Argentina and Turkey, which have increased their minimum wages by 100% or more from January 2022 levels. Turkey is suffering from an ongoing currency crisis, with the lira losing over 40% of its value in 2021. Prices of basic goods have increased considerably as the Turkish lira continues to plummet. In fact, a 2022 survey found that 70% of people in Turkey were struggling to pay for food. Argentina, South America’s second-biggest economy, is also suffering from very high inflation. In response, the country announced three minimum wage increases throughout 2022.
Minimum Wage in the U.S.
Within the U.S., minimum wage varies significantly by state. We’ve visualized each state’s basic minimum rate (hourly) using January 2023 data from the U.S. Department of Labor.
2023-03-17 Update: This map was updated to fix several incorrect values. We apologize for any confusion this may have caused. America’s federal minimum wage has remained unchanged since 2009 at $7.25 per hour. Each state is allowed to set their own minimum wage, as long as it’s higher than the federal minimum. In states that do not set their own minimum, the federal minimum applies. If we assume someone works 40 hours a week, the federal minimum wage of $7.25 translates to an annual figure of just $15,080 before taxes. California’s minimum wage of $15.50 translates to $32,240 before taxes. For further perspective, check out our 2022 infographic on the salary needed to buy a home across 50 U.S. cities.