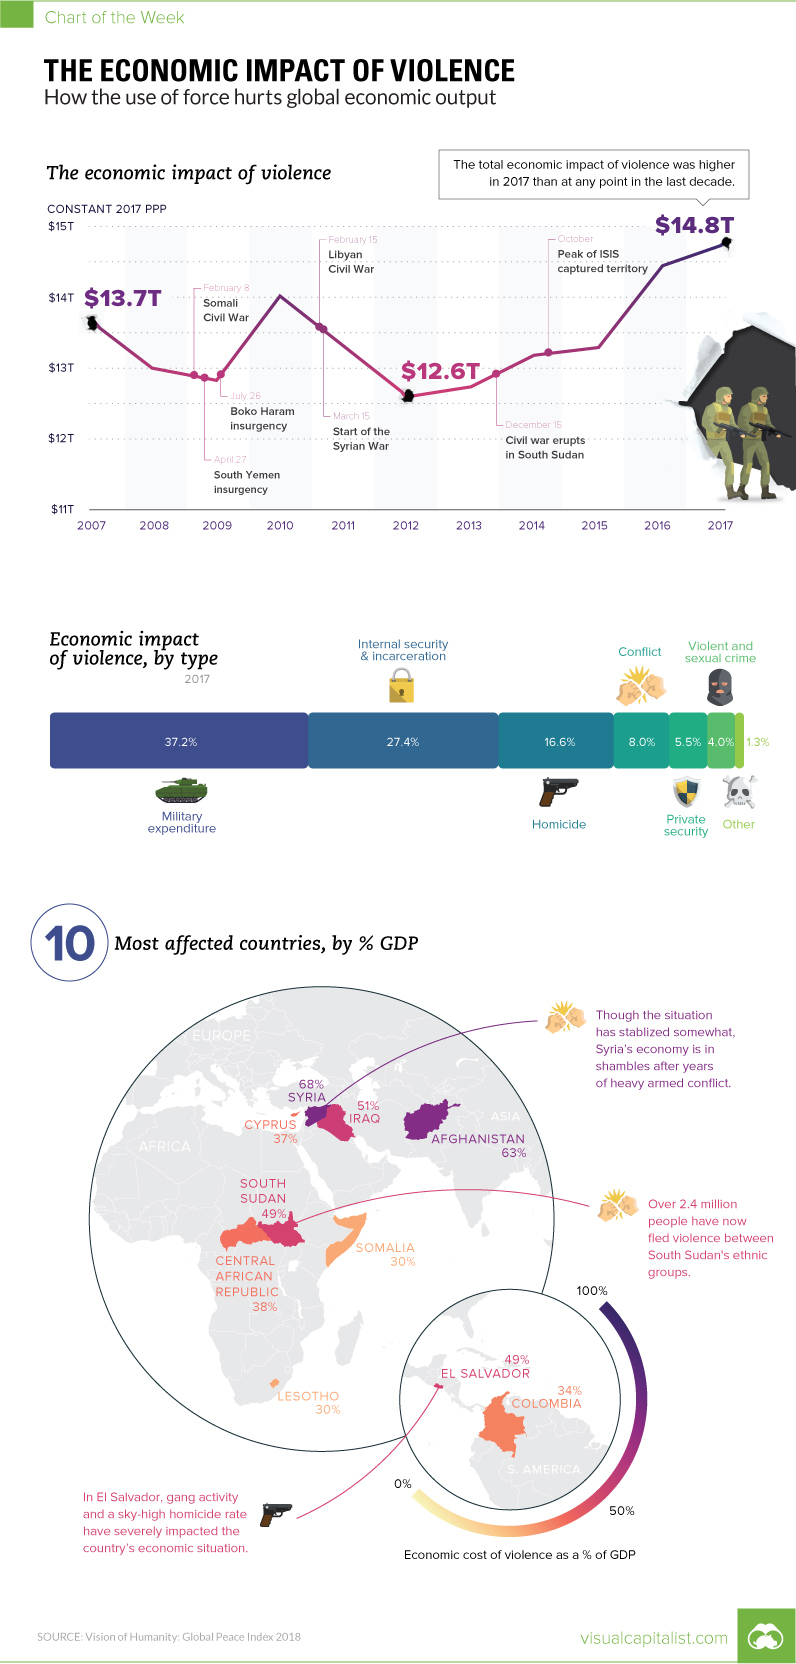
The Economic Impact of Violence
The Chart of the Week is a weekly Visual Capitalist feature on Fridays. When you regularly buy goods or services, it helps fuel the economy at both the local and national level. But what if you live in a place like Syria, that is torn apart by a seven-year long civil war? Aside from the obvious humanitarian costs, these dire circumstances would ultimately change your spending behavior, how businesses operate, and how capital gets utilized. The fact is that conflicts, homicides, terrorism, and other types of violence can hinder productivity and wealth creation, and this ultimately has an impact on families around the world.
Calculating an Economic Impact
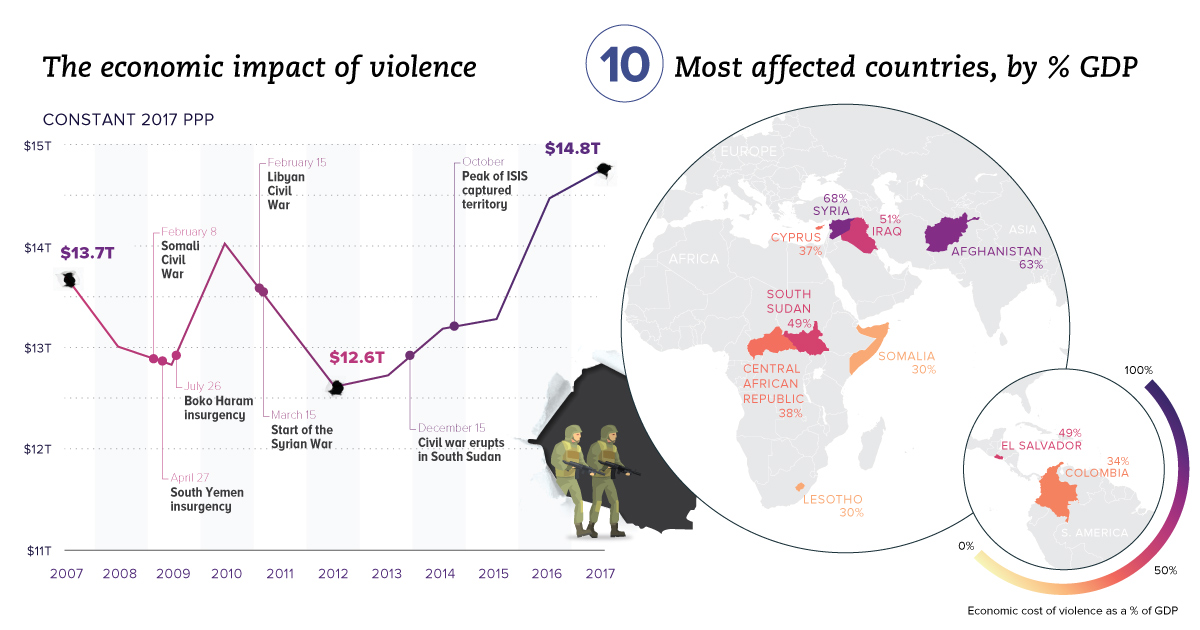
In today’s chart, we use data from the Global Peace Index 2018 report, which tries to put a figure on the expenditures and economic effects related to “containing, preventing and dealing with the consequences of violence”. According to the report, the economic impact of violence to the global economy was $14.76 trillion in 2017 in constant purchasing power parity (PPP) terms. This is roughly 12.4% of world gross domestic product (GDP), or $1,988 per person. While those figures themselves are quite staggering, how it all breaks down is even more interesting.
Violence by Type
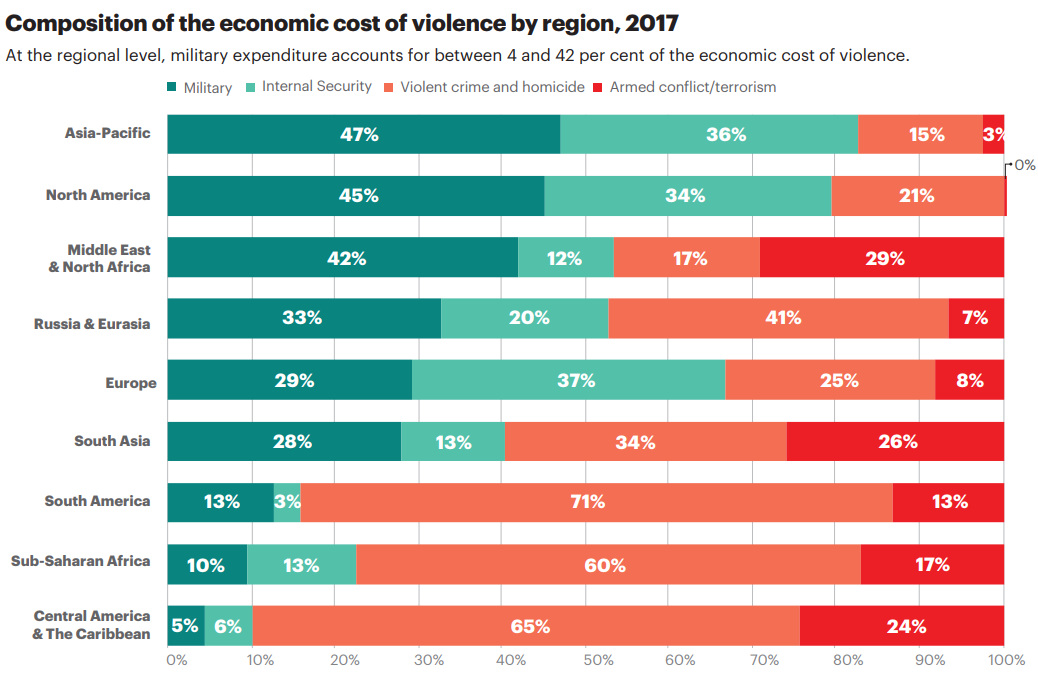
Violence comes in many forms, so how does factor into the economic impact? The Institute for Economics and Peace, the non-profit think tank that has authored the report for the last 12 years, breaks down economic impacts as follows: The vast majority of impact comes from military and security spending, which are both aimed at the prevention or containment of violence. Meanwhile, homicide and conflict – two more direct violent actions – are the next two biggest factors. Here’s how this breaks down by region:
Dollars are going to military and security spending in North America, Asia-Pacific, and Europe. Meanwhile, it’s actual violence like homicides, conflict, and terrorism that cause economic havoc in South America, Central America, and Africa.
The Countries Most Affected
Which countries are impacted the most by violence, as a percentage of their GDP? Here are the top 10, as per the report: Syria, which has been in its civil war for seven years now, is the country most affected by the economic impact of violence. Meanwhile, war-torn Afghanistan is not far behind. Interestingly, the cost of violence in Latin American countries is comparable to regions that have been at war for years. El Salvador ranks a surprising fourth place, due to its issues with gang activity and a sky-high homicide rate, and Colombia makes the list as well.
on The good news is that the Federal Reserve, U.S. Treasury, and Federal Deposit Insurance Corporation are taking action to restore confidence and take the appropriate measures to help provide stability in the market. With this in mind, the above infographic from New York Life Investments looks at the factors that impact bonds, how different types of bonds have historically performed across market environments, and the current bond market volatility in a broader context.
Bond Market Returns
Bonds had a historic year in 2022, posting one of the worst returns ever recorded. As interest rates rose at the fastest pace in 40 years, it pushed bond prices lower due to their inverse relationship. In a rare year, bonds dropped 13%.
Source: FactSet, 01/02/2023.
Bond prices are only one part of a bond’s total return—the other looks at the income a bond provides. As interest rates have increased in the last year, it has driven higher bond yields in 2023.
Source: YCharts, 3/20/2023.
With this recent performance in mind, let’s look at some other key factors that impact the bond market.
Factors Impacting Bond Markets
Interest rates play a central role in bond market dynamics. This is because they affect a bond’s price. When rates are rising, existing bonds with lower rates are less valuable and prices decline. When rates are dropping, existing bonds with higher rates are more valuable and their prices rise. In March, the Federal Reserve raised rates 25 basis points to fall within the 4.75%-5.00% range, a level not seen since September 2007. Here are projections for where the federal funds rate is headed in 2023:
Federal Reserve Projection*: 5.1% Economist Projections**: 5.3%
*Based on median estimates in the March summary of quarterly economic projections.**Projections based on March 10-15 Bloomberg economist survey. Together, interest rates and the macroenvironment can have a positive or negative effect on bonds.
Positive
Here are three variables that may affect bond prices in a positive direction:
Lower Inflation: Reduces likelihood of interest rate hikes. Lower Interest Rates: When rates are falling, bond prices are typically higher. Recession: Can prompt a cut in interest rates, boosting bond prices.
Negative
On the other hand, here are variables that may negatively impact bond prices:
Higher Inflation: Can increase the likelihood of the Federal Reserve to raise interest rates. Rising Interest Rates: Interest rate hikes lead bond prices to fall. Weaker Fundamentals: When a bond’s credit risk gets worse, its price can drop. Credit risk indicates the chance of a default, the risk of a bond issuer not making interest payments within a given time period.
Bonds have been impacted by these negative factors since inflation started rising in March 2021.
Fixed Income Opportunities
Below, we show the types of bonds that have had the best performance during rising rates and recessions.
Source: Derek Horstmeyer, George Mason University 12/3/2022. As we can see, U.S. ultrashort bonds performed the best during rising rates. Mortgage bonds outperformed during recessions, averaging 11.4% returns, but with higher volatility. U.S. long-term bonds had 7.7% average returns, the best across all market conditions. In fact, they were also a close second during recessions. When rates are rising, ultrashort bonds allow investors to capture higher rates when they mature, often with lower historical volatility.
A Closer Look at Bond Market Volatility
While bond market volatility has jumped this year, current dislocations may provide investment opportunities. Bond dislocations allow investors to buy at lower prices, factoring in that the fundamental quality of the bond remains strong. With this in mind, here are two areas of the bond market that may provide opportunities for investors:
Investment-Grade Corporate Bonds: Higher credit quality makes them potentially less vulnerable to increasing interest rates. Intermediate Bonds (2-10 Years): Allow investors to lock in higher rates.
Both types of bonds focus on quality and capturing higher yields when faced with challenging market conditions.
Finding the Upside
Much of the volatility seen in the banking sector was due to banks buying bonds during the pandemic—or even earlier—at a time when interest rates were historically low. Since then, rates have climbed considerably. Should rates moderate or stop increasing, this may present better market conditions for bonds. In this way, today’s steep discount in bond markets may present an attractive opportunity for price appreciation. At the same time, investors can potentially lock in strong yields as inflation may subside in the coming years ahead. Learn more about bond investing strategies with New York Life Investments.