While COVID-19 has triggered a tsunami of challenges for retailers the world over, they can take solace in knowing that retail events throughout the year can contribute to an uptick in sales. But consumer spending for events like Back to School, Halloween, or Easter pales in comparison to what people spend between Thanksgiving and New Years—otherwise known as “the holidays”. The graphic above explores holiday spending across the world, as well as some of the major events that contribute to it, based on MoEngage and AppFollow’s Holiday Marketing Guide.
Retail Events by Region
While Christmas is celebrated in some form across most parts of the world, U.S. consumers spend more than any other nation, with retailers raking in an estimated $1 trillion in sales in 2019. As another major retail holiday, Black Friday originated in the U.S. but has since become a global phenomenon. In 2019, sales for the one day event reached a staggering $7.4 billion in the U.S. alone, but it was surpassed by Cyber Monday, which garnered a total of $9.4 billion in sales. In other parts of Asia, Alibaba’s Singles’ Day is quickly becoming a highly anticipated event attracting attention from consumers in other parts of the world. But while it recorded $38 billion in revenue in 2019, it was meager in comparison to Chinese New Year sales during the same year, which topped $149 billion—although it does not take place during the holiday months covered in this graphic.
2020 Trends Impacting Retailers
Despite many retailers banking on the success of these holiday events, they are up against some critical challenges due to the ongoing COVID-19 pandemic.
Economic Uncertainty
According to the report, consumers have become more cautious about their spending, due to economic uncertainty of their finances. In fact, personal savings rates in the U.S. reached a historic 33% in May of this year.
More Value-Conscious Buyers
It’s no surprise that consumers’ concerns about the economy and their job prospects are affecting how they spend their hard-earned cash. They are spending less on items that may be considered a luxury, and investing more on things that can add value to their lives day-to-day, like media and entertainment.
Reluctance to Shop In-Store
Tightening lockdown restrictions and social distancing have raised some questions around how much of a role brick and mortar stores will play this year for consumers. Interestingly, a study shows that 36% of shoppers now prefer shopping online, up from 28% before the pandemic.
Supply Chain Issues
COVID-19 has wreaked havoc on retail supply chains, resulting in a number of issues arising such as labor shortages and transport restrictions. This has put many retailers under tremendous pressure to reimagine how they can best serve their customers.
The Most Wonderful Time of the Year?
Holiday shopping in 2020 will be anything but typical. Businesses of all shapes and sizes are having to adjust to changing consumer behaviors to ensure they make it through to 2021 intact. With tightening restrictions across the world, brick and mortar stores are becoming less of an option for millions of people, challenging retailers to focus efforts on their online experience. Forrester predicts that total retail sales in North America will decline in 2020 overall, while online sales will increase by 18.5%—growth not seen since 2008. Whether the reimagined supply chains of 2020 can keep up with more online demand is another question. on Similar to the the precedent set by the music industry, many news outlets have also been figuring out how to transition into a paid digital monetization model. Over the past decade or so, The New York Times (NY Times)—one of the world’s most iconic and widely read news organizations—has been transforming its revenue model to fit this trend. This chart from creator Trendline uses annual reports from the The New York Times Company to visualize how this seemingly simple transition helped the organization adapt to the digital era.
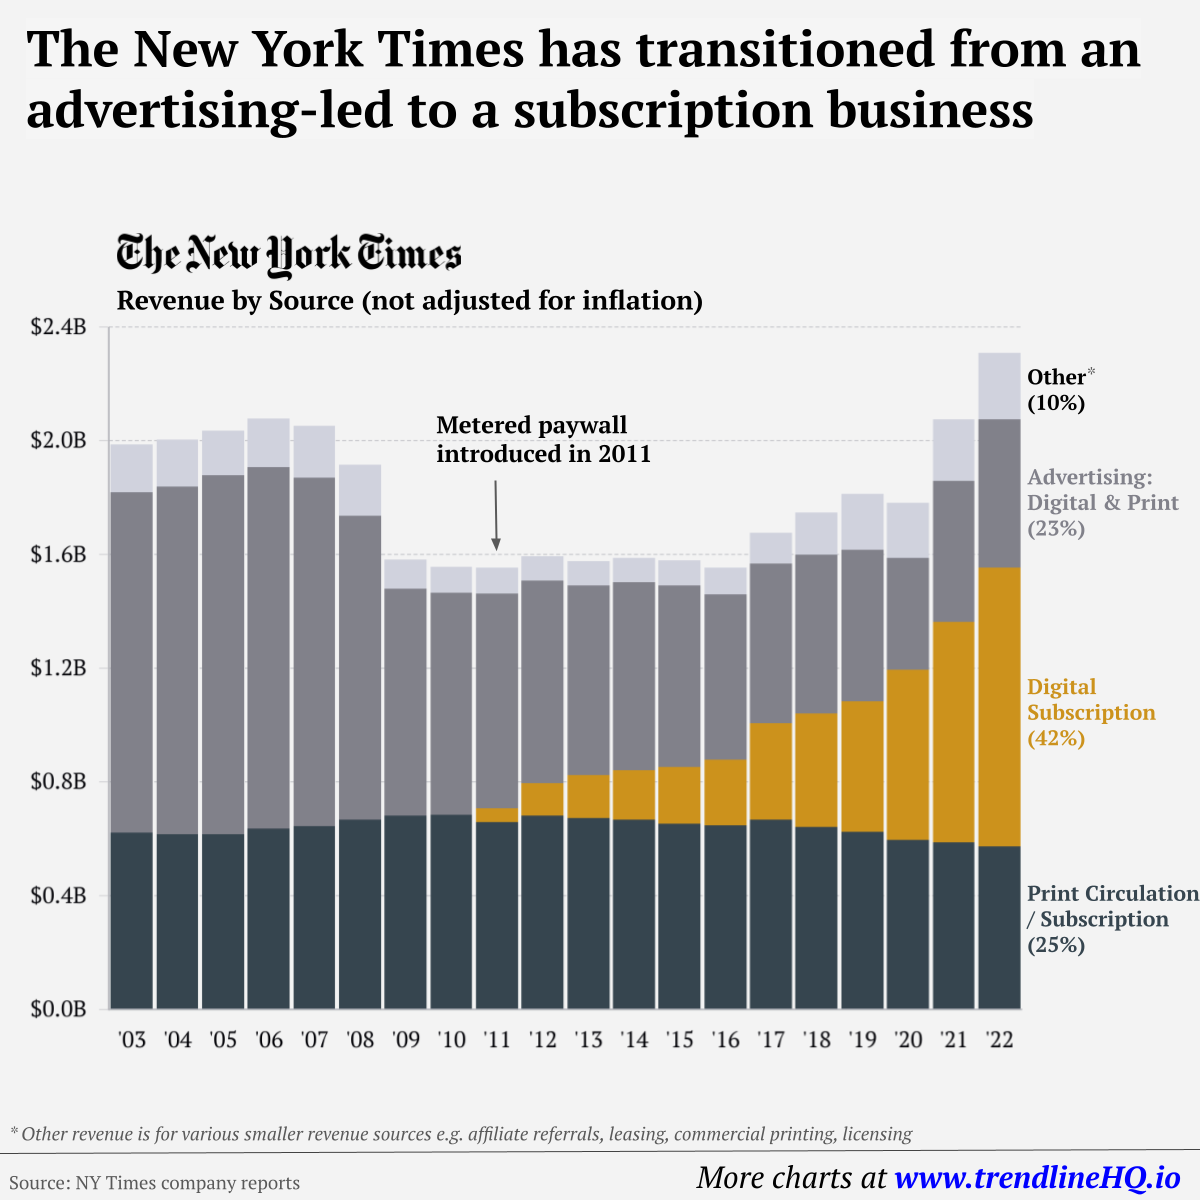
The New York Times’ Revenue Transition
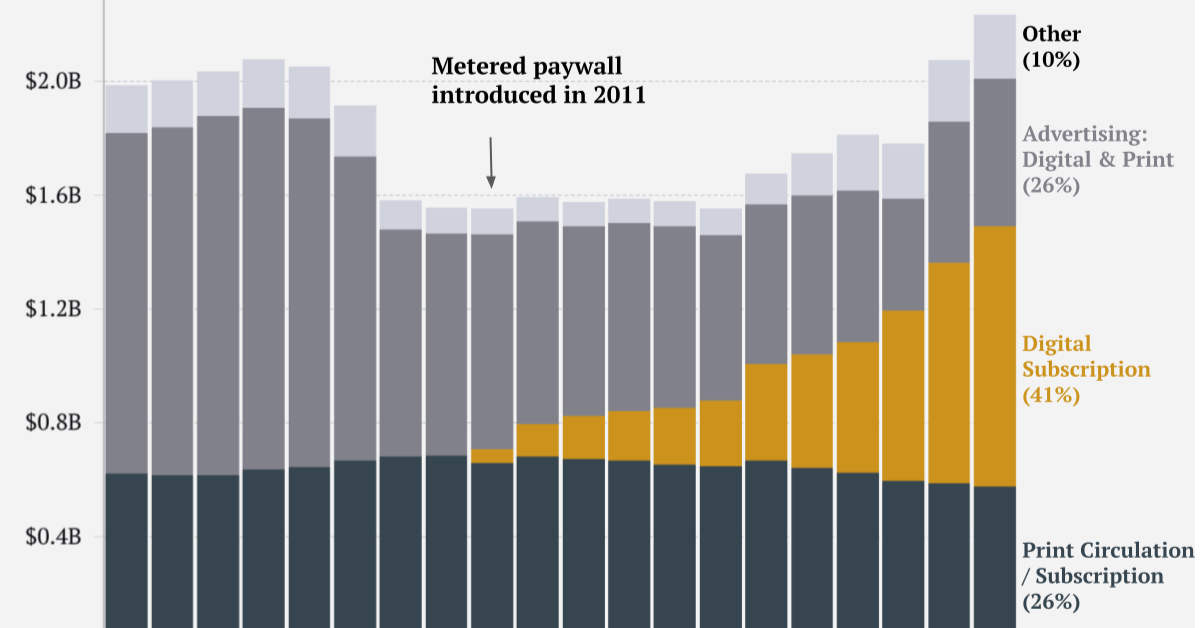
The NY Times has always been one of the world’s most-widely circulated papers. Before the launch of its digital subscription model, it earned half its revenue from print and online advertisements. The rest of its income came in through circulation and other avenues including licensing, referrals, commercial printing, events, and so on. But after annual revenues dropped by more than $500 million from 2006 to 2010, something had to change. In 2011, the NY Times launched its new digital subscription model and put some of its online articles behind a paywall. It bet that consumers would be willing to pay for quality content. And while it faced a rocky start, with revenue through print circulation and advertising slowly dwindling and some consumers frustrated that once-available content was now paywalled, its income through digital subscriptions began to climb. After digital subscription revenues first launched in 2011, they totaled to $47 million of revenue in their first year. By 2022 they had climbed to $979 million and accounted for 42% of total revenue.
Why Are Readers Paying for News?
More than half of U.S. adults subscribe to the news in some format. That (perhaps surprisingly) includes around four out of 10 adults under the age of 35. One of the main reasons cited for this was the consistency of publications in covering a variety of news topics. And given the NY Times’ popularity, it’s no surprise that it recently ranked as the most popular news subscription.