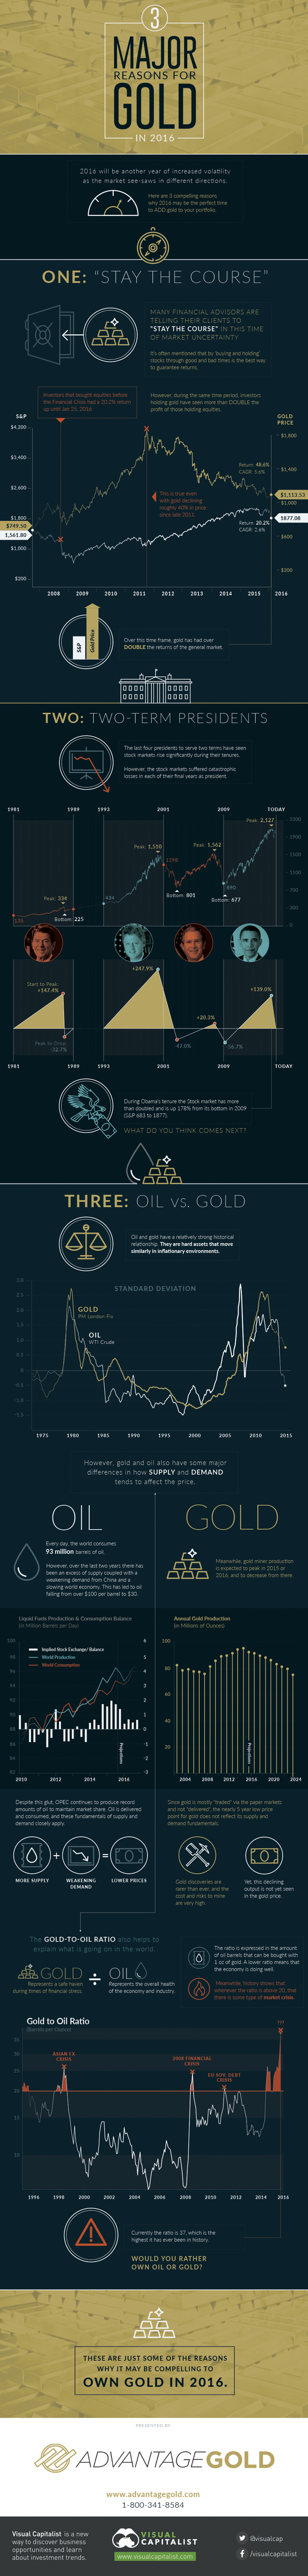
Three Major Reasons for Gold in 2016
Presented by: Advantage Gold This year looks to be another one of increased volatility as the market see-saws in different directions. Here are three compelling reasons why 2016 may be the perfect time to add gold to your portfolio.
1: “Stay the Course”
Financial experts often mention that “buying and holding” stocks through good and bad times is the best way to guarantee returns. Investors that bought equities before the Financial Crisis have had a 20.2% return up until January 25, 2016. They “stayed the course” and were rewarded with an eventual return. However, those that held gold during that same time period until today have had a 48.6% return, which is more than double that of the general market. This is even true with gold declining roughly 40% from its peak since late 2011. Does it make more sense to “stay the course” in 2016 with stocks, or gold?
2: Two-Term Presidents
The last four presidents to serve two terms have had stock markets rise significantly during their tenures. However, the stock markets also suffered catastrophic losses in each of their final years as president. For example, during George W. Bush’s tenure, the S&P 500 nearly doubled from a bottom of 801 during the Dotcom bust to a peak of 1,562. Then the Financial Crisis hit at the end of Bush’s second term and the market went down to 677 points. Obama is now in his last year, and the market is up 178% from its bottom in 2009. Will the trend continue?
3: Oil vs. Gold
Oil and gold have a relatively strong historical relationship. They are hard assets that move similarly in inflationary environments. However, gold and oil also have some major differences in how supply and demand tends to affect the price. Oil: Every day the world consumes 93 million barrels of oil. However, over the last two years there has been an excess of supply coupled with weakening demand from China and a slowing world economy. This has led to oil falling from over $100 per barrel to $30. Despite this glut, OPEC continues to produce record amounts of oil to maintain market share. Oil is delivered and consumed, and these fundamentals of supply and demand closely apply. More supply + weakening demand = lower prices. Gold: Meanwhile, gold miner production is expected to peak in 2015 or 2016, and to decrease from there. Since gold is mostly traded via paper markets and not delivered, the nearly five-year low price point for gold may not fully reflect its supply and demand fundamentals. Gold discoveries are rarer than ever, and the cost and risks to mine are very high. Yet, this declining output is not yet seen in the gold price. Gold to Oil Ratio Lastly, the ratio between these two goods helps to explain what is going on in the world. Gold represents a safe haven during times of financial stress, and oil represents the overall health of the economy and industry. The gold to oil ratio is expressed in the amount of oil barrels that can be bought with 1 oz of gold. A lower ratio means that the economy is doing well. Meanwhile, history shows that whenever the ratio is above 20, there has been some type of market crisis. Today, this ratio is higher than ever in history at 37. Would you rather own oil or gold?
on To see how the minimum wage differs around the world, we’ve visualized data from Picodi, which includes values for 67 countries as of January 2023.
Monthly Minimum Wage, by Country
The following table includes all of the data used in this infographic. Each value represents the monthly minimum wage a full-time worker would receive in each country. Picodi states that these figures are net of taxes and have been converted to USD. Generally speaking, developed countries have a higher cost of living, and thus require a higher minimum wage. Two outliers in this dataset are Argentina and Turkey, which have increased their minimum wages by 100% or more from January 2022 levels. Turkey is suffering from an ongoing currency crisis, with the lira losing over 40% of its value in 2021. Prices of basic goods have increased considerably as the Turkish lira continues to plummet. In fact, a 2022 survey found that 70% of people in Turkey were struggling to pay for food. Argentina, South America’s second-biggest economy, is also suffering from very high inflation. In response, the country announced three minimum wage increases throughout 2022.
Minimum Wage in the U.S.
Within the U.S., minimum wage varies significantly by state. We’ve visualized each state’s basic minimum rate (hourly) using January 2023 data from the U.S. Department of Labor.
2023-03-17 Update: This map was updated to fix several incorrect values. We apologize for any confusion this may have caused. America’s federal minimum wage has remained unchanged since 2009 at $7.25 per hour. Each state is allowed to set their own minimum wage, as long as it’s higher than the federal minimum. In states that do not set their own minimum, the federal minimum applies. If we assume someone works 40 hours a week, the federal minimum wage of $7.25 translates to an annual figure of just $15,080 before taxes. California’s minimum wage of $15.50 translates to $32,240 before taxes. For further perspective, check out our 2022 infographic on the salary needed to buy a home across 50 U.S. cities.