Today’s infographic comes from Fortune’s Nicolas Rapp, who used this data to visualize the CO2 emissions saved by 56 of the Fortune top 100 firms. In the graphic, each company’s CO2 savings are represented by an equivalent mass of coal not burned.
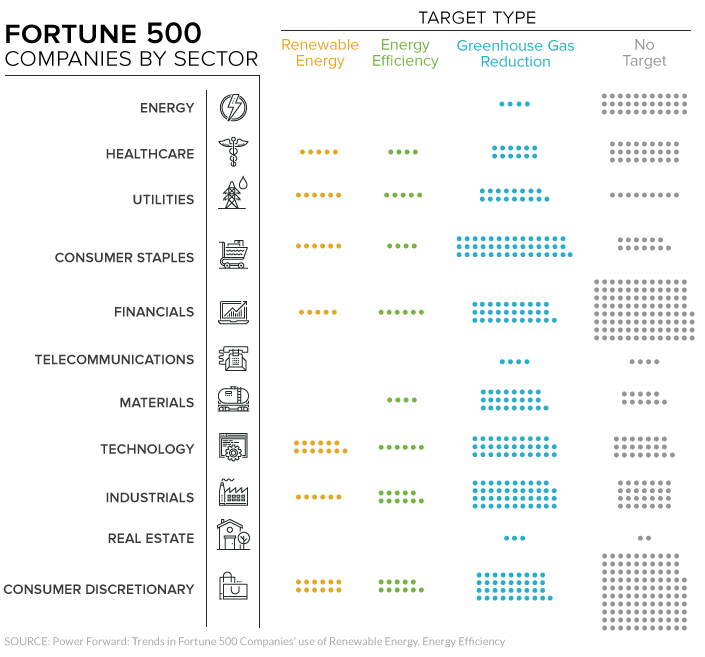
Big Companies, Big Goals
Nearly half (49%) of Fortune 500 companies in 2016 set targets to increase renewable energy sourcing, improve energy efficiency, or reduce greenhouse gas emissions (GHGs).
Over the course of the year, 190 of these companies managed to report a total $3.7 billion in cost savings thanks to some 80,000 emissions-reducing projects. That’s roughly equal to the impact of taking 45 coal-fired power plants offline.
Computing Giants Using Power Responsibly
Apple has done more than any other company on the Fortune list to reduce their environmental impact, saving the equivalent emissions of 35 billion pounds of burned coal. This alone would be enough to meet the year-round power consumption needs of 9.7 million homes – more than in the entirety of New York state. What types of initiatives are they implementing to make these kinds of efforts? According to their 2017 Sustainability Report, 96% of Apple’s electricity comes from renewable sources, including hydroelectric and solar. The company also recently issued $1 billion in “green bonds”, the proceeds of which are to be used in eco-friendly projects. This is in addition to an existing issue of $1.5 billion of green bonds from 2016. On the other hand, Microsoft is focused on energy efficiency, with the bulk of its work going towards improving the efficiency of data centers and buildings. As of 2016, roughly 44% of the electricity used by Microsoft data centers originates from wind, solar, and hydro energy sources.
Solar Power Shines for Big Box Retailers
Walmart, the largest brick and mortar retailer in the U.S., is also one of the biggest corporate users of solar power in the country. In 2005, Walmart’s former CEO, Lee Scott, set goals for the company’s store network to be powered entirely with renewable energy. Though they have not met this goal yet, Walmart’s adoption of solar has reduced its energy costs per square foot of retail floor space by 9% chainwide. Other companies with large installations of onsite solar panels include Prologis, Apple, Costco, Kohl’s, and IKEA.
Are Clear Skies Ahead?
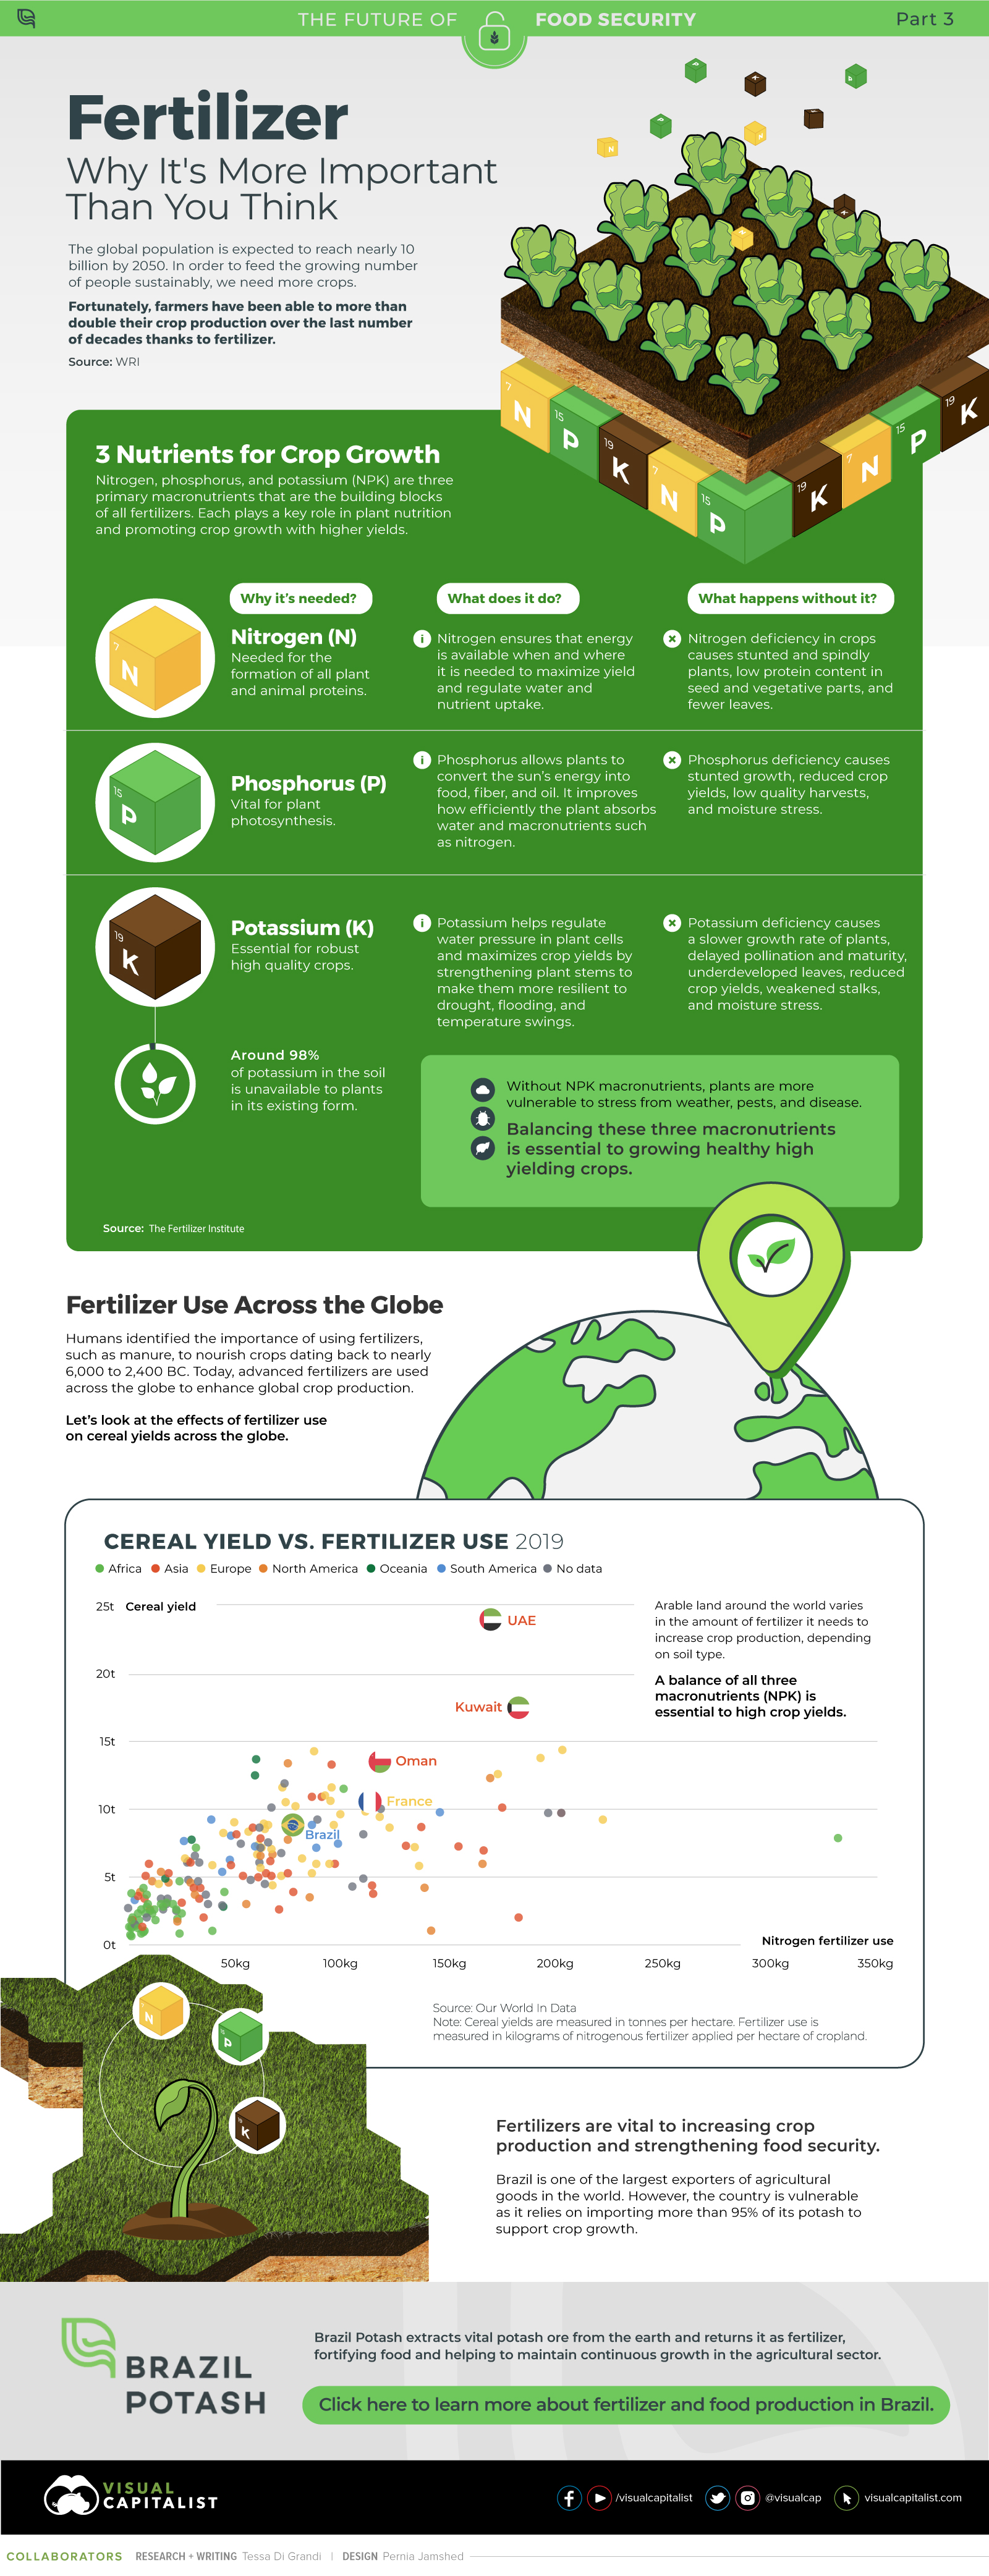
With the impending review of the Clean Power Plan’s role in American energy policy, the onus on large and powerful corporations to minimize their environmental impact is now greater than ever. Though we can already see the massive scale on which these firms have been able to improve their carbon footprints, even the equivalent of 35 billion pounds of burned coal is just the tip of the iceberg. on Over recent decades, farmers have been able to more than double their production of crops thanks to fertilizers and the vital nutrients they contain. When crops are harvested, the essential nutrients are taken away with them to the dining table, resulting in the depletion of these nutrients in the soil. To replenish these nutrients, fertilizers are needed, and the cycle continues. The above infographic by Brazil Potash shows the role that each macronutrient plays in growing healthy, high-yielding crops.
Food for Growth
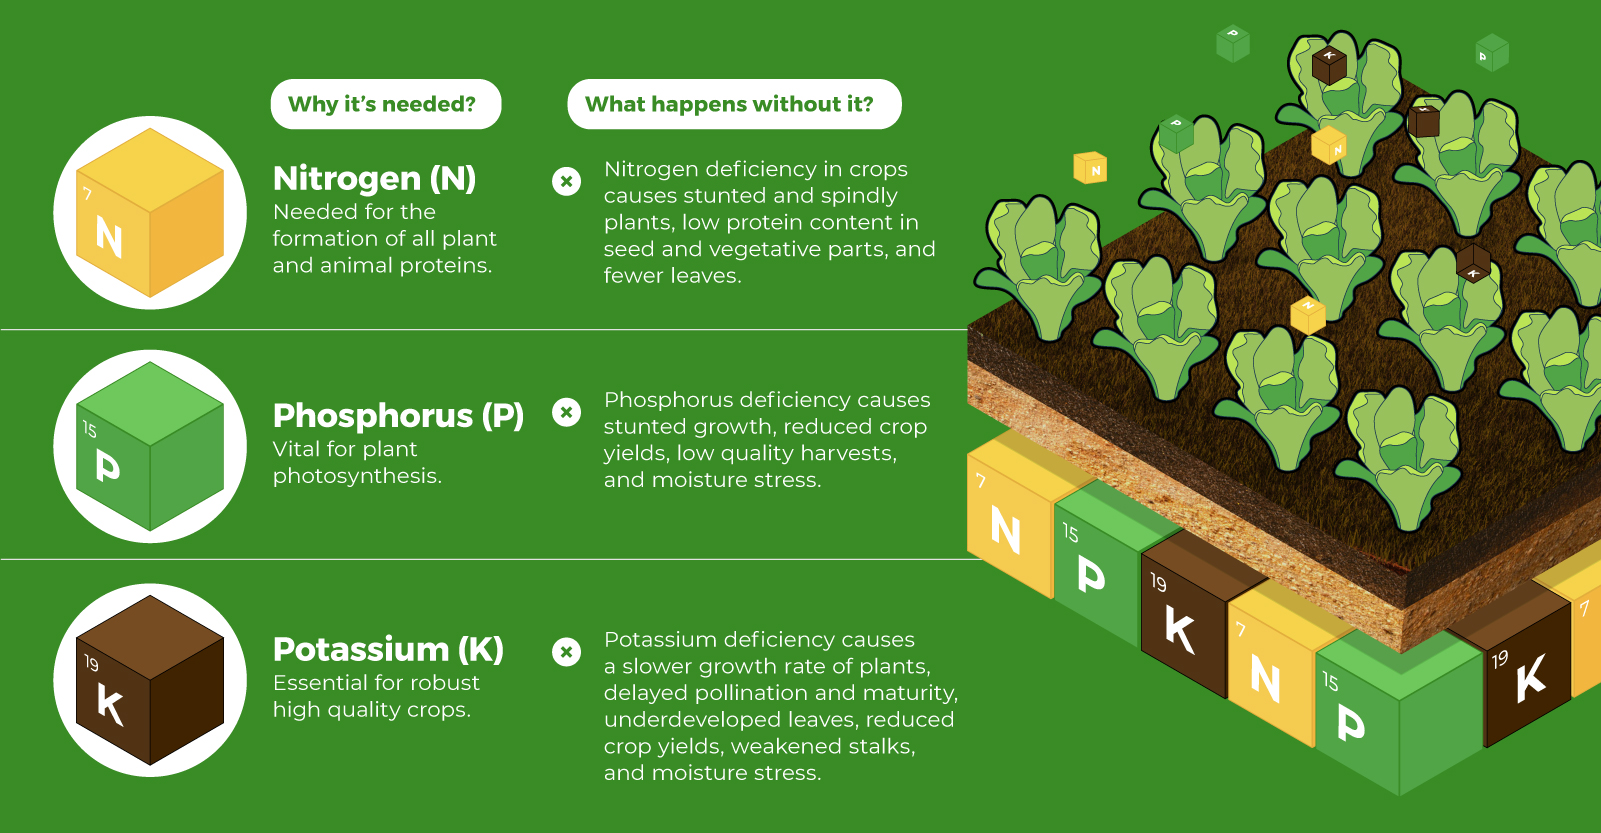
Nitrogen, phosphorus, and potassium (NPK) are three primary macronutrients that are the building blocks of the global fertilizer industry. Each plays a key role in plant nutrition and promoting crop growth with higher yields. Let’s take a look at how each macronutrient affects plant growth. If crops lack NPK macronutrients, they become vulnerable to various stresses caused by weather conditions, pests, and diseases. Therefore, it is crucial to maintain a balance of all three macronutrients for the production of healthy, high-yielding crops.
The Importance of Fertilizers
Humans identified the importance of using fertilizers, such as manure, to nourish crops dating back to nearly 6,000 to 2,400 BC. As agriculture became more intensive and large-scale, farmers began to experiment with different types of fertilizers. Today advanced chemical fertilizers are used across the globe to enhance global crop production. There are a myriad of factors that affect soil type, and so the farmable land must have a healthy balance of all three macronutrients to support high-yielding, healthy crops. Consequently, arable land around the world varies in the amount and type of fertilizer it needs. Fertilizers play an integral role in strengthening food security, and a supply of locally available fertilizer is needed in supporting global food systems in an ever-growing world. Brazil is one of the largest exporters of agricultural goods in the world. However, the country is vulnerable as it relies on importing more than 95% of its potash to support crop growth. Brazil Potash is developing a new potash project in Brazil to ensure a stable domestic source of this nutrient-rich fertilizer critical for global food security. Click here to learn more about fertilizer and food production in Brazil.