How Investment Goals Vary by Country and Age
It goes without saying that investors want to see their money grow. However, it turns out that why investors want their money to grow changes considerably, depending on who you are talking to.
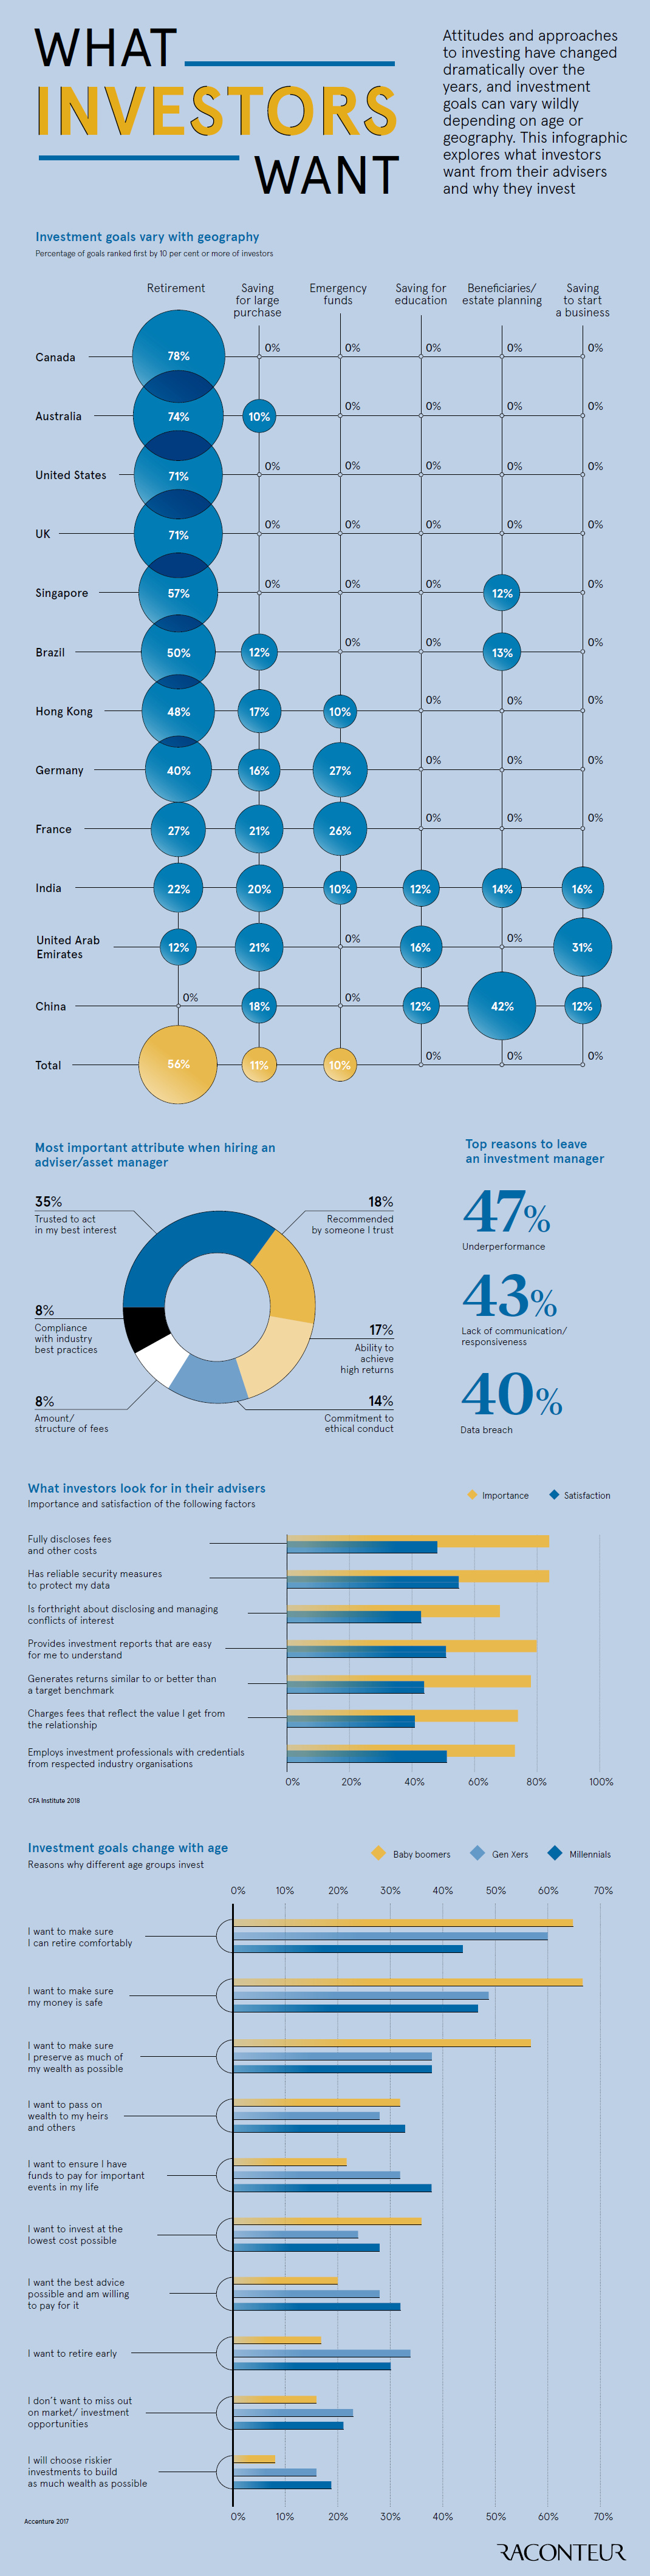
Investment Goals by Geography
Today’s infographic from Raconteur first shows why people invest based on country of residence. In the following table, we’ll show selected data to illustrate an interesting contrast between North American, Asian, and European cultures: In Canada, the United States, and the United Kingdom, saving for retirement is the primary investment goal for 70% or more of all respondents. However, in Europe and Asia, there is a much wider diversity of investment goals. In Germany and France, for example, close to a quarter of respondents mentioned that saving for an emergency was their primary goal, behind saving for retirement. Meanwhile, in the UAE and in China, the primary investment goal was not retirement – it was instead saving to start a business (UAE) and setting up family and/or beneficiaries for success (China).
Goals by Generation
It’s not just geographical boundaries, the level of economic development, and the local culture that impacts investment goals. Another factor is generational: Baby Boomers, Gen Xers, and Millennials are at very different stages of life, and each generation has their own quirky preferences, anyway. Not surprisingly, as people get older, their goals shift away from making immediate big-ticket purchases, and holding riskier investments for a higher rate of return. Later on in life, goals are more focused on retirement and maximizing wealth. That said, there are some anomalies in the above data that are interesting. For example, Millennials – not Baby Boomers – are most concerned about building wealth to pass onto their heirs. Finally, it is the Millennials that are willing to pay the most for investment advice, in order to get the best possible result.
on Last year, stock and bond returns tumbled after the Federal Reserve hiked interest rates at the fastest speed in 40 years. It was the first time in decades that both asset classes posted negative annual investment returns in tandem. Over four decades, this has happened 2.4% of the time across any 12-month rolling period. To look at how various stock and bond asset allocations have performed over history—and their broader correlations—the above graphic charts their best, worst, and average returns, using data from Vanguard.
How Has Asset Allocation Impacted Returns?
Based on data between 1926 and 2019, the table below looks at the spectrum of market returns of different asset allocations:
We can see that a portfolio made entirely of stocks returned 10.3% on average, the highest across all asset allocations. Of course, this came with wider return variance, hitting an annual low of -43% and a high of 54%.
A traditional 60/40 portfolio—which has lost its luster in recent years as low interest rates have led to lower bond returns—saw an average historical return of 8.8%. As interest rates have climbed in recent years, this may widen its appeal once again as bond returns may rise.
Meanwhile, a 100% bond portfolio averaged 5.3% in annual returns over the period. Bonds typically serve as a hedge against portfolio losses thanks to their typically negative historical correlation to stocks.
A Closer Look at Historical Correlations
To understand how 2022 was an outlier in terms of asset correlations we can look at the graphic below:
The last time stocks and bonds moved together in a negative direction was in 1969. At the time, inflation was accelerating and the Fed was hiking interest rates to cool rising costs. In fact, historically, when inflation surges, stocks and bonds have often moved in similar directions. Underscoring this divergence is real interest rate volatility. When real interest rates are a driving force in the market, as we have seen in the last year, it hurts both stock and bond returns. This is because higher interest rates can reduce the future cash flows of these investments. Adding another layer is the level of risk appetite among investors. When the economic outlook is uncertain and interest rate volatility is high, investors are more likely to take risk off their portfolios and demand higher returns for taking on higher risk. This can push down equity and bond prices. On the other hand, if the economic outlook is positive, investors may be willing to take on more risk, in turn potentially boosting equity prices.
Current Investment Returns in Context
Today, financial markets are seeing sharp swings as the ripple effects of higher interest rates are sinking in. For investors, historical data provides insight on long-term asset allocation trends. Over the last century, cycles of high interest rates have come and gone. Both equity and bond investment returns have been resilient for investors who stay the course.