However, in the last decade, a new option has emerged called “precious metals streaming” – in which streaming companies essentially offer capital up front to mining companies in exchange for metal later. If properly executed, the end result is a win for both parties that can ultimately provide value to investors.
Precious Metals Streaming
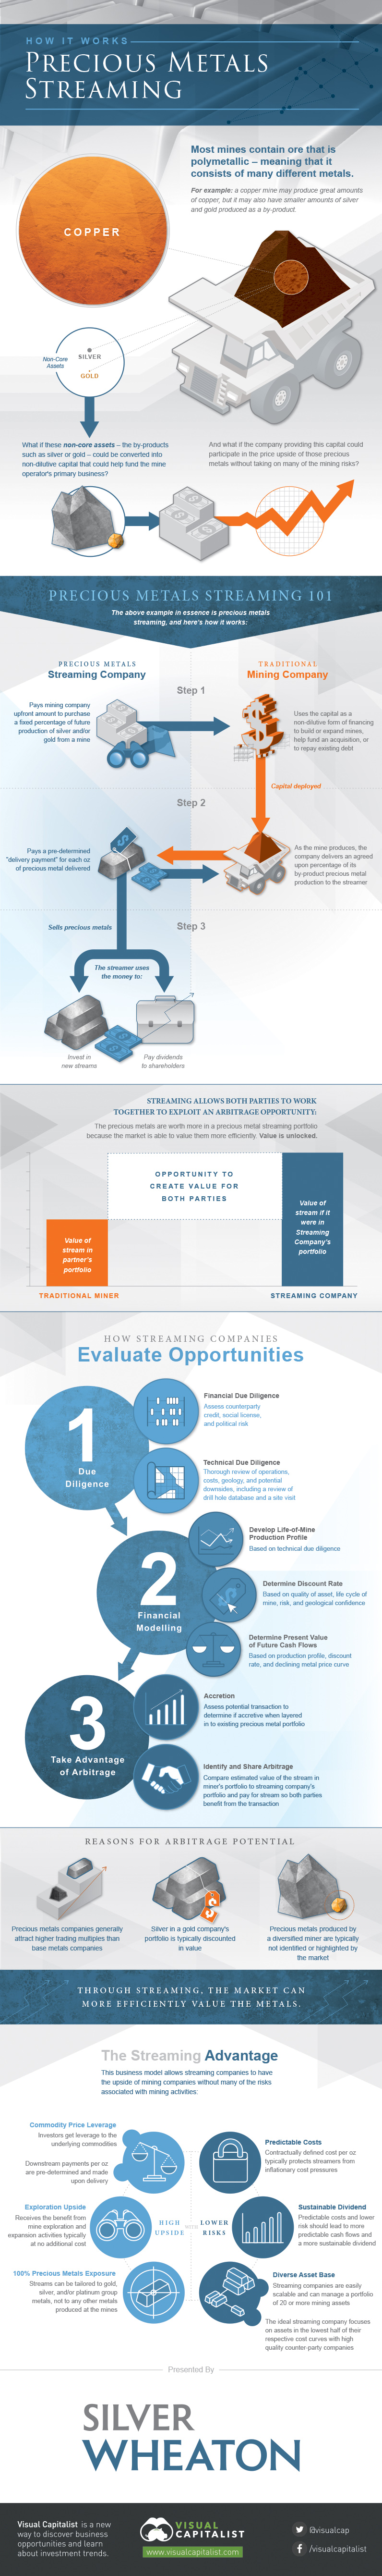
Today’s infographic from Silver Wheaton explains the precious metals streaming model, and the arbitrage opportunity that creates value for both the streamer and the miner seeking to acquire capital:
The aforementioned arbitrage opportunity in precious metals streaming is key. For a traditional base metal miner, the majority of forecasted mine revenue may come from a metal like copper or nickel. However, along with those “target” metals, smaller amounts of gold and silver may be produced from the deposit as well. Investors would still value those by-product precious metals in a base metal miner’s portfolio, but the metals may be typically valued at an even higher multiple in a precious metal streamer’s portfolio. This allows the base metal miner to transfer these future “streams” to the streamer in exchange for up-front capital, which can be a win-win scenario for both parties.
Streaming Benefits
In other words, miners use streaming to acquire non-dilutive financing, and to extract value from non-core assets. This allows them to deploy capital on purposes more central to their strategy. Major miners such as Teck, Barrick Gold, Vale, and Glencore all sold streams in 2015.
Meanwhile, streaming companies have been very successful since this model was first pioneered 12 years ago. They are getting gold and silver at a discount, and this has created significant amounts of value for investors over the last decade. Today, there are many valuable streaming companies out there, including the major ones such as Silver Wheaton, Royal Gold, and Franco-Nevada.
on
Last year, stock and bond returns tumbled after the Federal Reserve hiked interest rates at the fastest speed in 40 years. It was the first time in decades that both asset classes posted negative annual investment returns in tandem.
Over four decades, this has happened 2.4% of the time across any 12-month rolling period.
To look at how various stock and bond asset allocations have performed over history—and their broader correlations—the above graphic charts their best, worst, and average returns, using data from Vanguard.
How Has Asset Allocation Impacted Returns?
Based on data between 1926 and 2019, the table below looks at the spectrum of market returns of different asset allocations:
We can see that a portfolio made entirely of stocks returned 10.3% on average, the highest across all asset allocations. Of course, this came with wider return variance, hitting an annual low of -43% and a high of 54%.
A traditional 60/40 portfolio—which has lost its luster in recent years as low interest rates have led to lower bond returns—saw an average historical return of 8.8%. As interest rates have climbed in recent years, this may widen its appeal once again as bond returns may rise.
Meanwhile, a 100% bond portfolio averaged 5.3% in annual returns over the period. Bonds typically serve as a hedge against portfolio losses thanks to their typically negative historical correlation to stocks.
A Closer Look at Historical Correlations
To understand how 2022 was an outlier in terms of asset correlations we can look at the graphic below:
The last time stocks and bonds moved together in a negative direction was in 1969. At the time, inflation was accelerating and the Fed was hiking interest rates to cool rising costs. In fact, historically, when inflation surges, stocks and bonds have often moved in similar directions. Underscoring this divergence is real interest rate volatility. When real interest rates are a driving force in the market, as we have seen in the last year, it hurts both stock and bond returns. This is because higher interest rates can reduce the future cash flows of these investments. Adding another layer is the level of risk appetite among investors. When the economic outlook is uncertain and interest rate volatility is high, investors are more likely to take risk off their portfolios and demand higher returns for taking on higher risk. This can push down equity and bond prices. On the other hand, if the economic outlook is positive, investors may be willing to take on more risk, in turn potentially boosting equity prices.
Current Investment Returns in Context
Today, financial markets are seeing sharp swings as the ripple effects of higher interest rates are sinking in. For investors, historical data provides insight on long-term asset allocation trends. Over the last century, cycles of high interest rates have come and gone. Both equity and bond investment returns have been resilient for investors who stay the course.