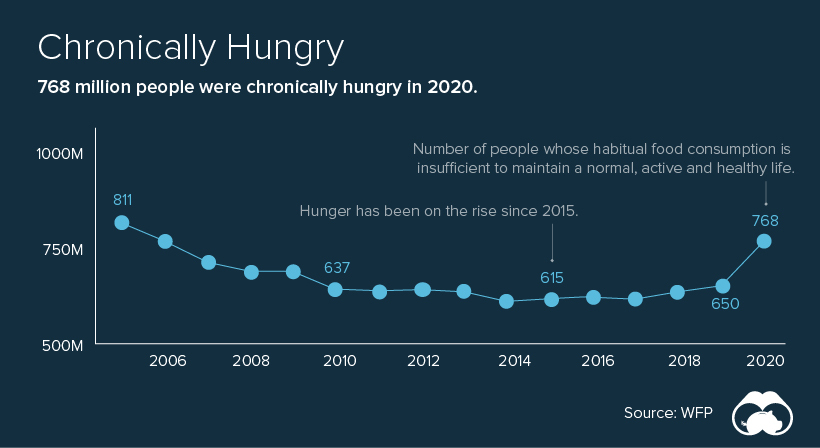
Every day, more than 700 million people (8.8% of the world’s population) go to bed on an empty stomach, according to the UN World Food Programme (WFP). The WFP’s HungerMap LIVE displayed here tracks core indicators of acute hunger like household food consumption, livelihoods, child nutritional status, mortality, and access to clean water in order to rank countries. But whereas acute hunger measures short-term inability to meet food consumption requirements, often related to crises, many people in the world also suffer from chronic hunger. This is the persistent inability to meet food consumption requirements, usually lasting for at least six months.
After sitting closer to 600 million from 2014 to 2019, the number of people in the world affected by hunger increased during the COVID-19 pandemic. In 2020, 155 million people (2% of the world’s population) experienced acute hunger, requiring urgent assistance.
The Fight to Feed the World
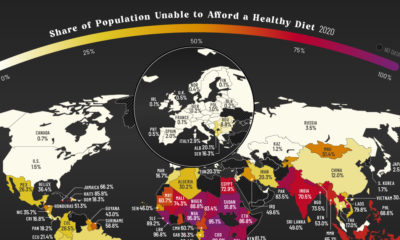
The problem of world hunger isn’t new and attempts to solve it have made headlines for decades. On July 13, 1985, at Wembley Stadium in London, Prince Charles and Princess Diana officially opened Live Aid, a worldwide rock concert organized to raise money for the relief of famine-stricken Africans. The event was followed by similar concerts at other arenas around the world, globally linked by satellite to more than a billion viewers in 110 nations, raising more than $125 million ($309 million in today’s dollars) in famine relief for Africa. But 35+ years later, the continent still struggles. According to the UN, from 12 countries with the highest prevalence of insufficient food consumption in the world, nine are in Africa. Approximately 30 million people in Africa face the effects of severe food insecurity, including malnutrition, starvation, and poverty.
Wasted Leftovers
Although many of the reasons for the food crisis around the globe involve conflicts or environmental challenges, one of the big contributors is food waste. According to the United Nations, one-third of food produced for human consumption is lost or wasted globally. This amounts to about 1.3 billion tons of wasted food per year, worth approximately $1 trillion. All the food produced but never eaten would be sufficient to feed two billion people. That’s more than twice the number of undernourished people across the globe. Consumers in rich countries waste almost as much food as the entire net food production of sub-Saharan Africa each year.
Solving World Hunger
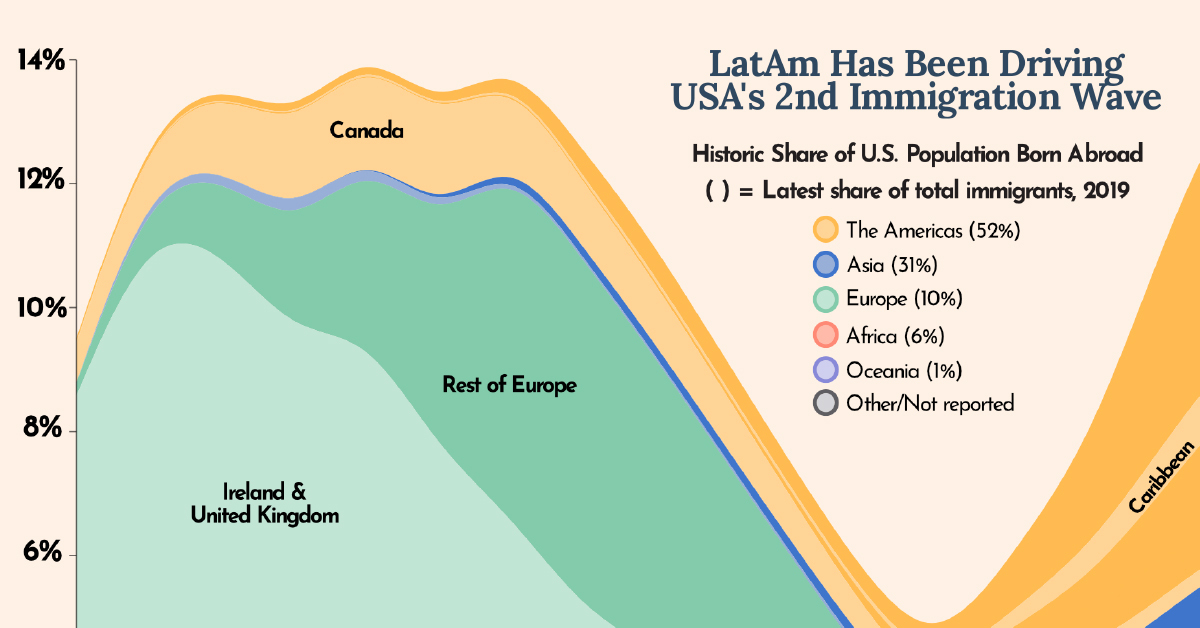
While many people may not be “hungry” in the sense that they are suffering physical discomfort, they may still be food insecure, lacking regular access to enough safe and nutritious food for normal growth and development. Estimates of how much money it would take to end world hunger range from $7 billion to $265 billion per year. But to tackle the problem, investments must be utilized in the right places. Specialists say that governments and organizations need to provide food and humanitarian relief to the most at-risk regions, increase agricultural productivity, and invest in more efficient supply chains. on Since the 1970s, the region has driven the second wave of U.S. immigration and helped shape the country’s future immeasurably. This is especially clear when looking at Census data listing where people were born. This chart from Latinometrics looks at the history of U.S. immigration considering both documented and undocumented immigration since 1850.
Historical U.S. Immigration
For most of its early history, Europeans drove immigration to the United States. The UK, Ireland, and Germany were especially big sources of American immigrants well into the 20th century. But around the 1960-70s this began to shift, with LatAm countries marking the next wave of U.S. immigration. Here’s a sample of the history of U.S. immigration using select years and regions:
LatAm Immigration
As of 2019, 22.6 million foreign-born people in the U.S. were originally from LatAm countries, with 10.9 million from Mexico alone. Additionally, in 2021 Mexican citizens received the highest number of U.S. immigrant visas in the world at almost 40,600. Immigrant visas are the first step in the process to U.S. green cards and citizenship. And though Asian countries are beginning to make up the majority of U.S. immigrant applicants and permits, other LatAm countries also ranked high in issued permits in 2021:
🇩🇴 Dominican Republic: 17.9K 🇸🇻 El Salvador: 7.8K 🇪🇨 Ecuador: 5.1K 🇨🇴 Colombia: 4.8K
Furthermore, there is also undocumented immigration to consider. According to 2019 figures from Brookings, there are between 10.5-12 million undocumented migrants living in the U.S.—making up just over 3% of the population. Here’s a look at the top five countries in terms of undocumented immigration to the U.S. in 2019, most of which are LatAm countries:
The Future of U.S. Immigration
In the last few years, more and more Asian countries are seeing their citizens leave for the United States. In addition, the knock-on effects of the COVID-19 pandemic and the Russo-Ukrainian War (as well as other global events and crises) could shift U.S. immigration even further away from LatAm. Currently, the U.S. is only permitting small numbers of legal immigrants to enter the country each year, numbering in only the hundreds of thousands. But as birth rates decline, the growth in the foreign-born population will continue to be a much-discussed and important topic for the country’s demographics in the coming years.