Recently, lockdown restrictions have been enacted in major cities like Shenzhen and Shanghai, as China deals with one of its worst outbreaks since Wuhan in December 2019. These cautionary measures have had far-reaching impacts on China’s economy, especially on its supply chain and logistics operations. Shanghai’s port system, which handles about one-fifth of China’s export containers, is currently experiencing significant delays as a result of the recent government lockdown.
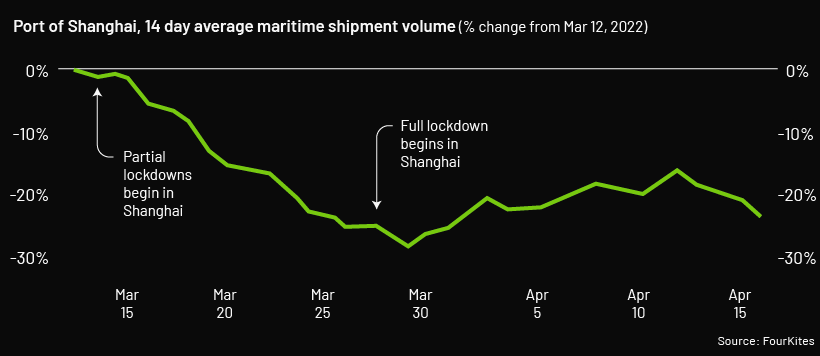
Shipping volume has dipped drastically since early March this year, right after partial lockdowns began in Shanghai. By the end of March, as restrictions continued to tighten up, shipping activity dipped nearly 30% compared to pre-lockdown levels. And while activity has recently picked up, it’s still far below average shipment volumes prior to the recent lockdown. While the port is still technically operating, shipping delays will likely cause hiccups in the global supply chain. That’s because the Shanghai port is a major hub for international trade, and one of the largest and busiest container ports in the world.
How Bad is the Back-Up?
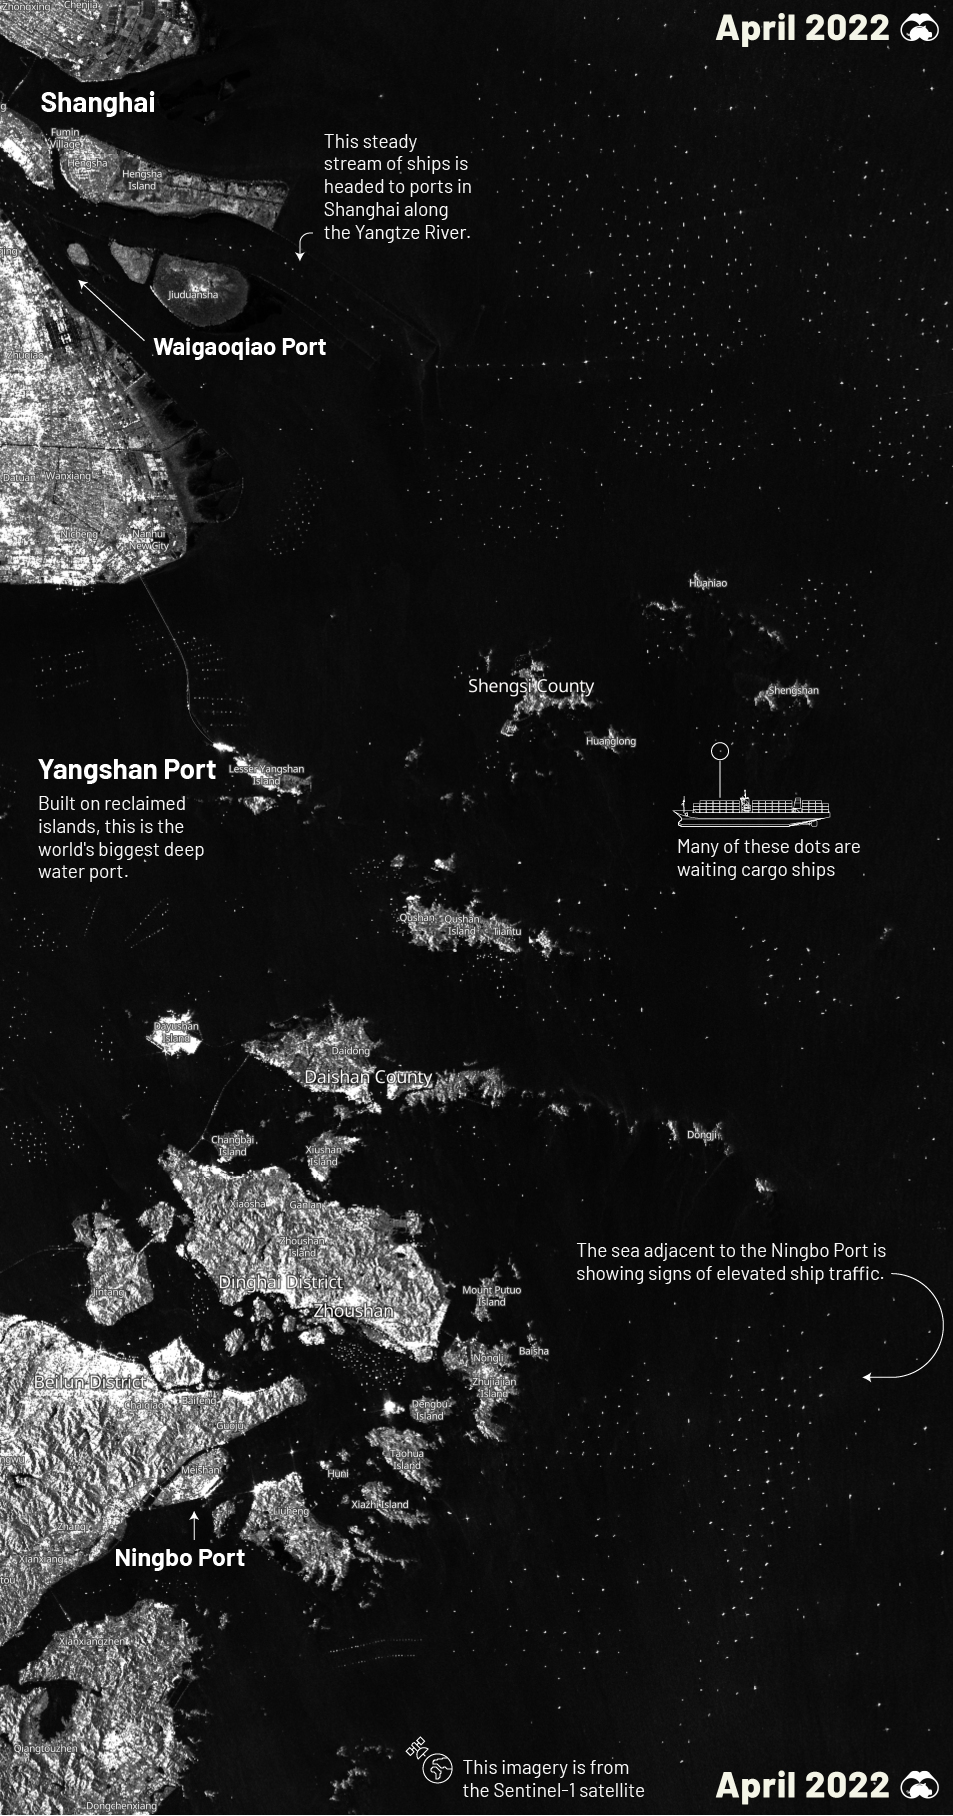
Here’s a closer look at satellite imagery that was captured by the Sentinel-1 satellite, which shows the current congestion at Shanghai’s port as of April 14, 2022. In the image, a majority of the white dots are cargo ships, many of which have been stuck in limbo for days.
Traffic has been building up at the Shanghai terminal. As of April 19, 2022, over 470 ships are still waiting to deliver goods to China. If you’d like to check out the Shanghai ports most up-to-date traffic, this live map by MarineTraffice provides real-time updates. Much of these delays are due to transport issues—an estimated 90% of trucks that support import and export activities are currently offline, which is causing dwell time for containers at Shanghai marine terminals to increase drastically. Wait times for at Shanghai marine terminals has increased nearly 75% since the lockdowns began. Delays at the Shanghai terminal have sent ships to neighboring ports in Ningbo and Yangshan, but those ports are beginning to get congested as well. The global impacts of this current bottleneck are still pending, and depend greatly on the length of Shanghai’s lockdown. According to an article in Freight Waves, this could turn into the biggest supply chain issue since the start of the pandemic if China’s marine shipping congestion isn’t cleared up soon. on Last year, stock and bond returns tumbled after the Federal Reserve hiked interest rates at the fastest speed in 40 years. It was the first time in decades that both asset classes posted negative annual investment returns in tandem. Over four decades, this has happened 2.4% of the time across any 12-month rolling period. To look at how various stock and bond asset allocations have performed over history—and their broader correlations—the above graphic charts their best, worst, and average returns, using data from Vanguard.
How Has Asset Allocation Impacted Returns?
Based on data between 1926 and 2019, the table below looks at the spectrum of market returns of different asset allocations:
We can see that a portfolio made entirely of stocks returned 10.3% on average, the highest across all asset allocations. Of course, this came with wider return variance, hitting an annual low of -43% and a high of 54%.
A traditional 60/40 portfolio—which has lost its luster in recent years as low interest rates have led to lower bond returns—saw an average historical return of 8.8%. As interest rates have climbed in recent years, this may widen its appeal once again as bond returns may rise.
Meanwhile, a 100% bond portfolio averaged 5.3% in annual returns over the period. Bonds typically serve as a hedge against portfolio losses thanks to their typically negative historical correlation to stocks.
A Closer Look at Historical Correlations
To understand how 2022 was an outlier in terms of asset correlations we can look at the graphic below:
The last time stocks and bonds moved together in a negative direction was in 1969. At the time, inflation was accelerating and the Fed was hiking interest rates to cool rising costs. In fact, historically, when inflation surges, stocks and bonds have often moved in similar directions. Underscoring this divergence is real interest rate volatility. When real interest rates are a driving force in the market, as we have seen in the last year, it hurts both stock and bond returns. This is because higher interest rates can reduce the future cash flows of these investments. Adding another layer is the level of risk appetite among investors. When the economic outlook is uncertain and interest rate volatility is high, investors are more likely to take risk off their portfolios and demand higher returns for taking on higher risk. This can push down equity and bond prices. On the other hand, if the economic outlook is positive, investors may be willing to take on more risk, in turn potentially boosting equity prices.
Current Investment Returns in Context
Today, financial markets are seeing sharp swings as the ripple effects of higher interest rates are sinking in. For investors, historical data provides insight on long-term asset allocation trends. Over the last century, cycles of high interest rates have come and gone. Both equity and bond investment returns have been resilient for investors who stay the course.