America’s property market is no exception to this rule. Depending on the city and its—you guessed it—location, there are vast discrepancies in real estate value across the country. Using the latest data from LendingTree, this graphic ranks the top 30 most valuable real estate cities in America. We’ll also evaluate the top cities based on median value of homes, and how COVID-19 has impacted the market.
The Most Valuable Real Estate Cities
Out of the $32.6 trillion of total real estate value included in LendingTree’s database, the top 30 cities account for almost 57%: New York has the highest real estate value in the country at $2.8 trillion—that’s around the size of the UK’s GDP in 2019. Close behind is Los Angeles at $2.3 trillion, while San Francisco ranks third at $1.3 trillion. This may not come as a surprise, considering the popularity of these areas. New York and Los Angeles have the two highest city populations in the U.S., and San Francisco is the second most densely populated city in America (after New York). Historically, these areas have been notorious for their red-hot real estate markets, limited housing supply, and high costs of living. However, while these cities take the top three spots when it comes to total real estate value, the ranking looks a bit different when comparing the median value of each city.
Most Valuable Cities, by Median Home Value
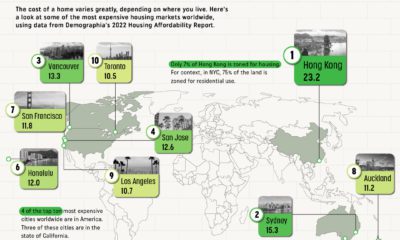
When it comes to median home value, San Jose claims the top spot at $1.1 million, while San Francisco places second at $959K: The Bay Area leads the pack in terms of median value, but San Francisco and San Jose aren’t the only Californian cities to make the list. In fact, half of the top 10 cities are in the Golden State.
Suburban Shuffle
It’s important to note that these numbers are from January 2020, before the global pandemic triggered numerous societal and economic changes, including an accelerated migration to the suburbs from key urban centers like New York and San Francisco. This mass exodus has negatively impacted sales activity. In fall 2020, or example, home sales in New York dropped by 50% compared to last year. In contrast, places like Honolulu have seen significant growth in home sales—in September 2020, single-family home sales rose by 12.7% compared to last year. Some experts believe COVID has been a key factor driving this growth, as more people are able to work from anywhere, thanks to remote work. on Last year, stock and bond returns tumbled after the Federal Reserve hiked interest rates at the fastest speed in 40 years. It was the first time in decades that both asset classes posted negative annual investment returns in tandem. Over four decades, this has happened 2.4% of the time across any 12-month rolling period. To look at how various stock and bond asset allocations have performed over history—and their broader correlations—the above graphic charts their best, worst, and average returns, using data from Vanguard.
How Has Asset Allocation Impacted Returns?
Based on data between 1926 and 2019, the table below looks at the spectrum of market returns of different asset allocations:
We can see that a portfolio made entirely of stocks returned 10.3% on average, the highest across all asset allocations. Of course, this came with wider return variance, hitting an annual low of -43% and a high of 54%.
A traditional 60/40 portfolio—which has lost its luster in recent years as low interest rates have led to lower bond returns—saw an average historical return of 8.8%. As interest rates have climbed in recent years, this may widen its appeal once again as bond returns may rise.
Meanwhile, a 100% bond portfolio averaged 5.3% in annual returns over the period. Bonds typically serve as a hedge against portfolio losses thanks to their typically negative historical correlation to stocks.
A Closer Look at Historical Correlations
To understand how 2022 was an outlier in terms of asset correlations we can look at the graphic below:
The last time stocks and bonds moved together in a negative direction was in 1969. At the time, inflation was accelerating and the Fed was hiking interest rates to cool rising costs. In fact, historically, when inflation surges, stocks and bonds have often moved in similar directions. Underscoring this divergence is real interest rate volatility. When real interest rates are a driving force in the market, as we have seen in the last year, it hurts both stock and bond returns. This is because higher interest rates can reduce the future cash flows of these investments. Adding another layer is the level of risk appetite among investors. When the economic outlook is uncertain and interest rate volatility is high, investors are more likely to take risk off their portfolios and demand higher returns for taking on higher risk. This can push down equity and bond prices. On the other hand, if the economic outlook is positive, investors may be willing to take on more risk, in turn potentially boosting equity prices.
Current Investment Returns in Context
Today, financial markets are seeing sharp swings as the ripple effects of higher interest rates are sinking in. For investors, historical data provides insight on long-term asset allocation trends. Over the last century, cycles of high interest rates have come and gone. Both equity and bond investment returns have been resilient for investors who stay the course.