A few months ago, the western U.S. experienced one of the worst droughts it’s seen in the last 20 years. At the same time, southern Europe roasted in an extreme heatwave, with temperatures reaching 45°C in some parts. But things are only expected to get worse in the near future. Here’s a look at how much extreme climate events have changed over the last 200 years, and what’s to come if global temperatures keep rising.
A Century of Warming
The global surface temperature has increased by about 1°C since the 1850s. And according to the IPCC, this warming has been indisputably caused by human influence. As the global temperatures have risen, the frequency of extreme weather events have increased along with it. Heatwaves, droughts and extreme rainstorms used to happen once in a decade on average, but now:
Heatwaves are 2.8x more frequent Droughts are 1.7x more frequent Extreme rainstorms are 1.3x more frequent
By 2030, the global surface temperature is expected to rise 1.5°C above the Earth’s baseline temperature, which means that:
Heatwaves would be 4.1x more frequent Droughts would be 2x more frequent Extreme rainstorms would be 1.5x more frequent
The Ripple Effects of Extreme Weather
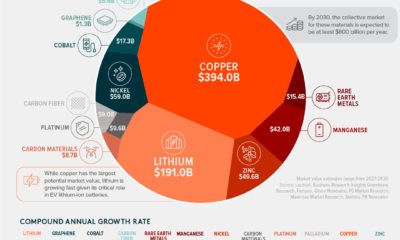
Extreme weather events have far-reaching impacts on communities, especially when they cause critical system failures. Mass infrastructure breakdowns during Hurricane Ida this year caused widespread power outages in the state of Louisiana that lasted for several days. In 2020, wildfires in Syria devastated hundreds of villages and injured dozens of civilians with skin burns and breathing complications. As extreme weather events continue to increase in frequency, and communities become increasingly more at risk, sound infrastructure is becoming more important than ever. Source: IPCC Details: The data used in this graphic is from the IPCC’s Sixth Assessment Report, which provides a high-level summary of the state of the climate, how it’s changing, and the role of human influence. on Today’s connected cars come stocked with as many as 200 onboard sensors, tracking everything from engine temperature to seatbelt status. And all those sensors create reams of data, which will increase exponentially as the autonomous driving revolution gathers pace. With carmakers planning on uploading 50-70% of that data, this has serious implications for policymakers, manufacturers, and local network infrastructure. In this visualization from our sponsor Global X ETFs, we ask the question: will connected cars break the internet?
Data is a Plural Noun
Just how much data could it possibly be? There are lots of estimates out there, from as much as 450 TB per day for robotaxis, to as little as 0.383 TB per hour for a minimally connected car. This visualization adds up the outputs from sensors found in a typical connected car of the future, with at least some self-driving capabilities. The focus is on the kinds of sensors that an automated vehicle might use, because these are the data hogs. Sensors like the one that turns on your check-oil-light probably doesn’t produce that much data. But a 4K camera at 30 frames a second, on the other hand, produces 5.4 TB per hour. All together, you could have somewhere between 1.4 TB and 19 TB per hour. Given that U.S. drivers spend 17,600 minutes driving per year, a vehicle could produce between 380 and 5,100 TB every year. To put that upper range into perspective, the largest commercially available computer storage—the 100 TB SSD Exadrive from Nimbus—would be full in 5 hours. A standard Blu-ray disc (50 GB) would be full in under 2 seconds.
Lag is a Drag
The problem is twofold. In the first place, the internet is better at downloading than uploading. And this makes sense when you think about it. How often are you uploading a video, versus downloading or streaming one? Average global mobile download speeds were 30.78 MB/s in July 2022, against 8.55 MB/s for uploads. Fixed broadband is much higher of course, but no one is suggesting that you connect really, really long network cables to moving vehicles.
Ultimately, there isn’t enough bandwidth to go around. Consider the types of data traffic that a connected car could produce:
Vehicle-to-vehicle (V2V) Vehicle-to-grid (V2G) Vehicles-to-people (V2P) Vehicles-to-infrastructure (V2I) Vehicles-to-everything (V2E)
The network just won’t be able to handle it.
Moreover, lag needs to be relatively non-existent for roads to be safe. If a traffic camera detects that another car has run a red light and is about to t-bone you, that message needs to get to you right now, not in a few seconds.
Full to the Gunwales
The second problem is storage. Just where is all this data supposed to go? In 2021, total global data storage capacity was 8 zettabytes (ZB) and is set to double to 16 ZB by 2025.
One study predicted that connected cars could be producing up to 10 exabytes per month, a thousand-fold increase over current data volumes.
At that rate, 8 ZB will be full in 2.2 years, which seems like a long time until you consider that we still need a place to put the rest of our data too.
At the Bleeding Edge
Fortunately, not all of that data needs to be uploaded. As already noted, automakers are only interested in uploading some of that. Also, privacy legislation in some jurisdictions may not allow highly personal data, like a car’s exact location, to be shared with manufacturers.
Uploading could also move to off-peak hours to even out demand on network infrastructure. Plug in your EV at the end of the day to charge, and upload data in the evening, when network traffic is down. This would be good for maintenance logs, but less useful for the kind of real-time data discussed above.
For that, Edge Computing could hold the answer. The Automotive Edge Computing Consortium has a plan for a next generation network based on distributed computing on localized networks. Storage and computing resources stay closer to the data source—the connected car—to improve response times and reduce bandwidth loads.
Invest in the Future of Road Transport
By 2030, 95% of new vehicles sold will be connected vehicles, up from 50% today, and companies are racing to meet the challenge, creating investing opportunities.
Learn more about the Global X Autonomous & Electric Vehicles ETF (DRIV). It provides exposure to companies involved in the development of autonomous vehicles, EVs, and EV components and materials.
And be sure to read about how experiential technologies like Edge Computing are driving change in road transport in Charting Disruption. This joint report by Global X ETFs and the Wall Street Journal is also available as a downloadable PDF.