The price you pay for groceries, dinner at the restaurant, filling up your tank, or even your daily coffee goes up substantially. With high-paying jobs, booming economies, limited space, and soaring levels of density, cities can be expensive.
Dollar Disparity
While this effect on costs is most evident in cities, it’s actually present throughout the country. What you can buy for your paycheck varies wildly depending on where you are, greatly impacting purchasing power and the cost of living. Sometimes even a short one-hour drive can make a difference in some cases. Today’s two maps come from TaxFoundation.org, and they look at regional differences in purchasing power, based on information from the Bureau of Economic Analysis.
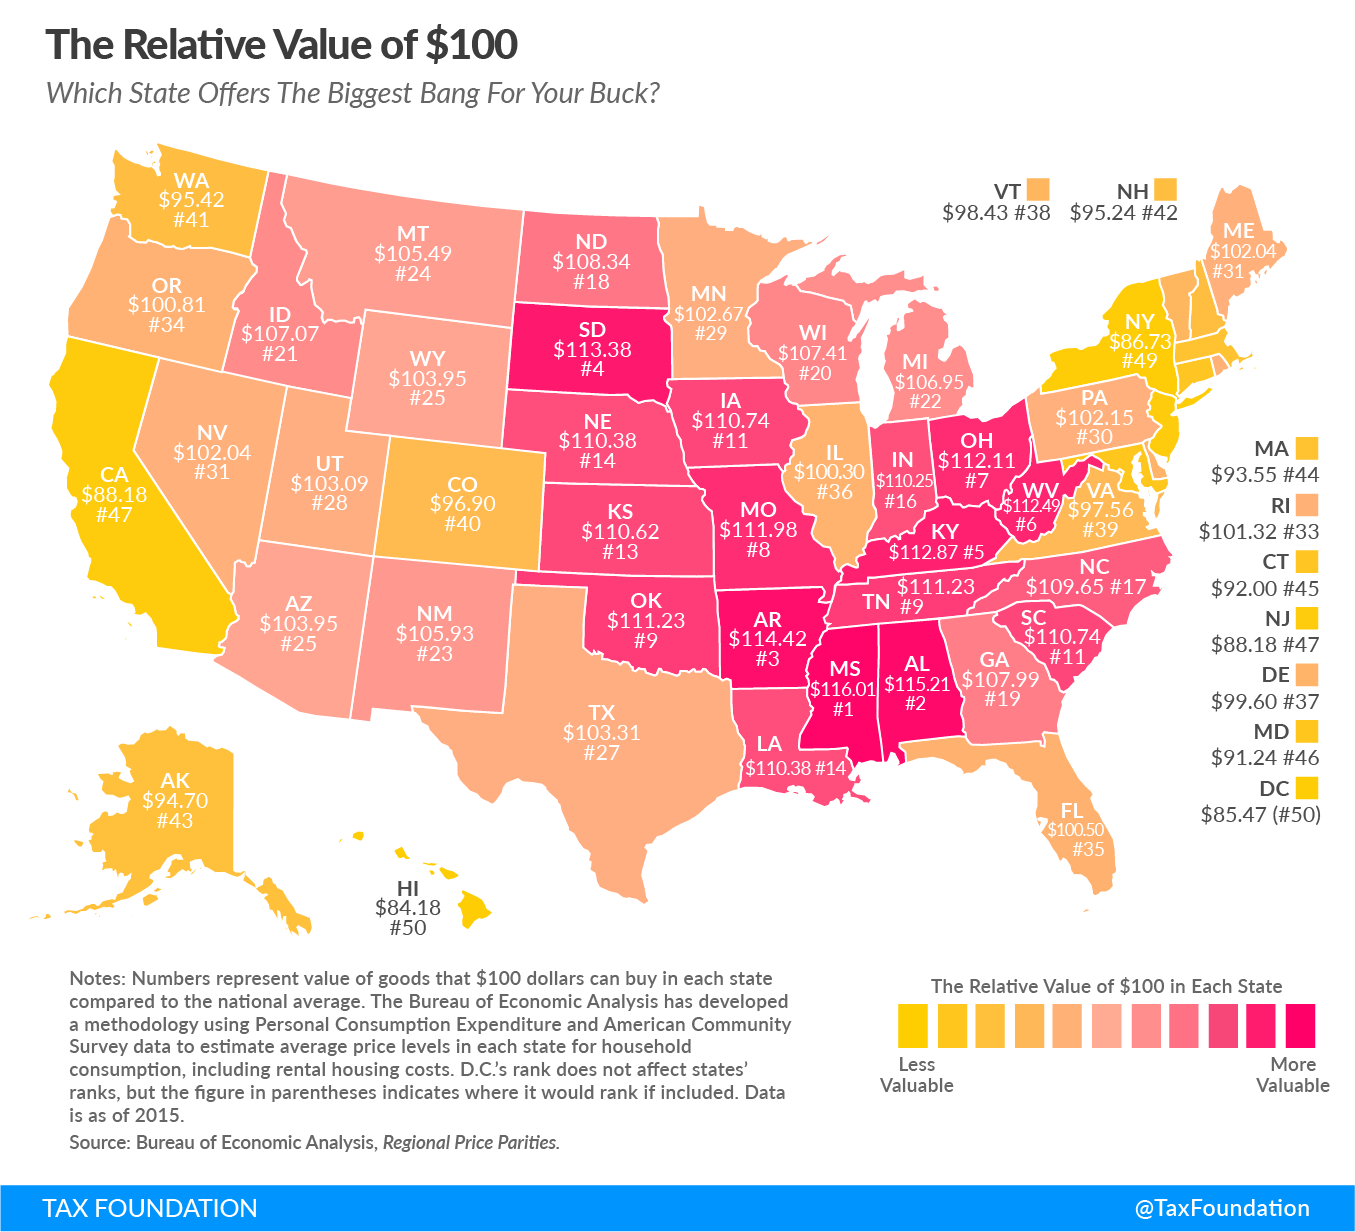
Bang for Buck, by State
The following map shows the buying power of $100 by state. If the number is below, such as $90, it means money buys less than the federal average. If a state’s number is higher, such as $110, that means each dollar goes further, giving residents more purchasing power.
Generally speaking, dollars go furthest in states in the Southeast and Midwest parts of the country. Go to places like Arkansas or South Dakota, and you’ll see higher purchasing power. Here are the five states that have the most buying power: And here are the five with the least buying power:
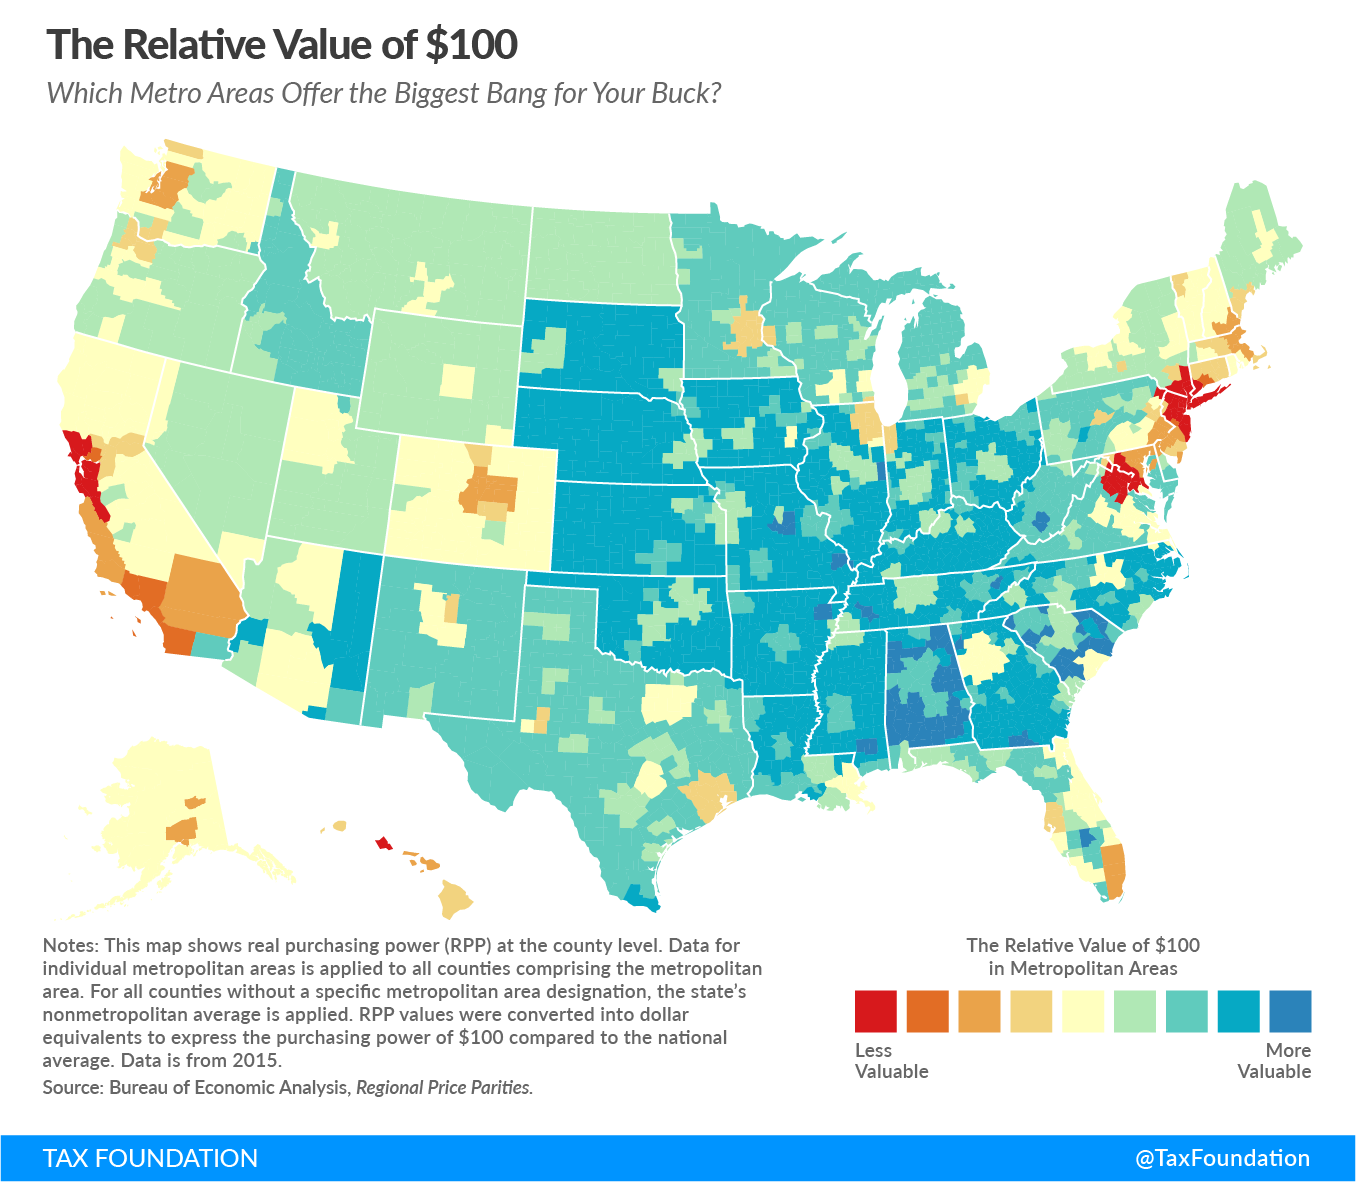
Bang for Buck, by County
The state map does not tell the whole story, however. The reality is that density makes a big difference for buying power, and large metropolitan areas tend to be more expensive. The following chart breaks it down based on county, creating a much more interesting contrast.
The above rendition makes it clear that the Bay Area, New York City, and Washington D.C. are the places where the relative value of a dollar is lowest. Meanwhile, it also shows that metropolitan areas in some parts of the country are not too bad for the cost of living. Cities like Atlanta ($104.10), Nashville ($106.50), Phoenix ($102.90), Milwaukee ($104.50), Kansas City ($106.70), Jacksonville ($104.40), and New Orleans ($104.60) buck the trend, being cheaper than the American average. Here’s another look – this time with an interactive map that allows you to hover over individual metro areas:
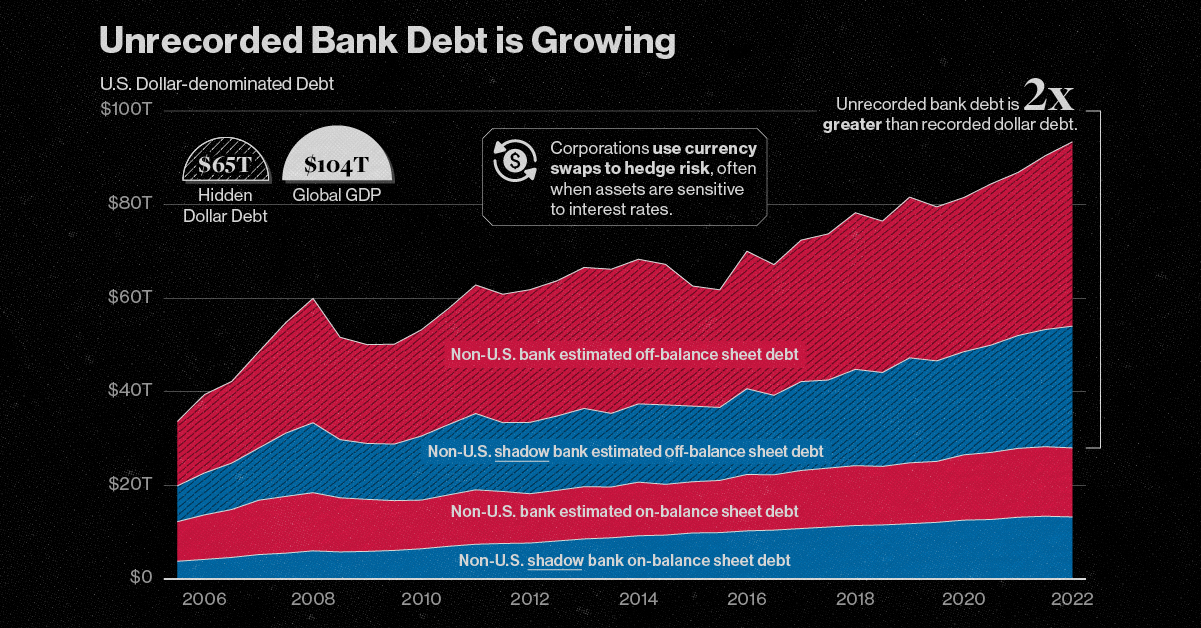
on The scale of hidden dollar debt around the world is huge. No less than $65 trillion in unrecorded dollar debt circulates across the global financial system in non-U.S. banks and shadow banks. To put in perspective, global GDP sits at $104 trillion. This dollar debt is in the form of foreign-exchange swaps, which have exploded over the last decade due to years of monetary easing and ultra-low interest rates, as investors searched for higher yields. Today, unrecorded debt from these foreign-exchange swaps is worth more than double the dollar debt officially recorded on balance sheets across these institutions. Based on analysis from the Bank of International Settlements (BIS), the above infographic charts the rise in hidden dollar debt across non-U.S. financial institutions and examines the wider implications of its growth.
Dollar Debt: A Beginners Guide
To start, we will briefly look at the role of foreign-exchange (forex) swaps in the global economy. The forex market is the largest in the world by a long stretch, with trillions traded daily. Some of the key players that use foreign-exchange swaps are:
Corporations Financial institutions Central banks
To understand forex swaps is to look at the role of currency risk. As we have seen in 2022, the U.S. dollar has been on a tear. When this happens, it hurts company earnings that generate revenue across borders. That’s because they earn revenue in foreign currencies (which have likely declined in value against the dollar) but end up converting earnings to U.S. dollars. In order to reduce currency risk, market participants will buy forex swaps. Here, two parties agree to exchange one currency for another. In short, this helps protect the company from unfavorable foreign exchange rates. What’s more, due to accounting rules, forex swaps are often unrecorded on balance sheets, and as a result are quite opaque.
A Mountain of Debt
Since 2008, the value of this opaque, unrecorded dollar debt has nearly doubled.
*As of June 30, 2022
Driving its rise in part was an era of rock-bottom interest rates globally. As investors sought out higher returns, they took on greater leverage—and forex swaps are one example of this.
Now, as interest rates have been rising, forex swaps have increased amid higher market volatility as investors look to hedge currency risk. This appears in both non-U.S. banks and non-U.S. shadow banks, which are unregulated financial intermediaries.
Overall, the value of unrecorded debt is staggering. An estimated $39 trillion is held by non-U.S. banks along with $26 trillion in overseas shadow banks around the world.
Past Case Studies
Why does the massive growth in dollar debt present risks? During the market crashes of 2008 and 2020, forex swaps faced a funding squeeze. To borrow U.S. dollars, market participants had to pay high rates. A lot of this hinged on the impact of extreme volatility on these swaps, putting pressure on funding rates. Here are two examples of how volatility can heighten risk in the forex market:
Exchange-rate volatility: Sharp swings in USD can spur a liquidity crunch U.S. interest-rate volatility: Sudden rate fluctuations can mean much higher costs for these trades
In both cases, the U.S. central bank had to step in to provide liquidity in the market and prevent dollar shortages. This was done through pumping cash into the system and creating swap lines with other non-U.S. banks such as the Bank of Canada or the Bank of Japan. These were designed to protect from declining currency values and a liquidity crunch.
Dollar Debt: The Wider Implications
The risk from growing dollar debt and these swap lines arises when a non-U.S. bank or shadow bank may not be able to hold up their end of the agreement. In fact, on a daily basis, there is an estimated $2.2 trillion in forex swaps exposed to settlement risk. Given its vast scale, this dollar debt could have greater systemic spillover effects. If participants fail to pay it could undermine financial market stability. Because demand for U.S. dollars increases during market uncertainty, a worsening economic climate could potentially expose the forex market to more vulnerabilities.