The tallest buildings require vast amounts of materials, expertise, and capital to make them a reality, but the cities that add these landmarks to their skylines gain prestige and send a powerful message to competing economic centers.
Skyscraper Construction in 2018
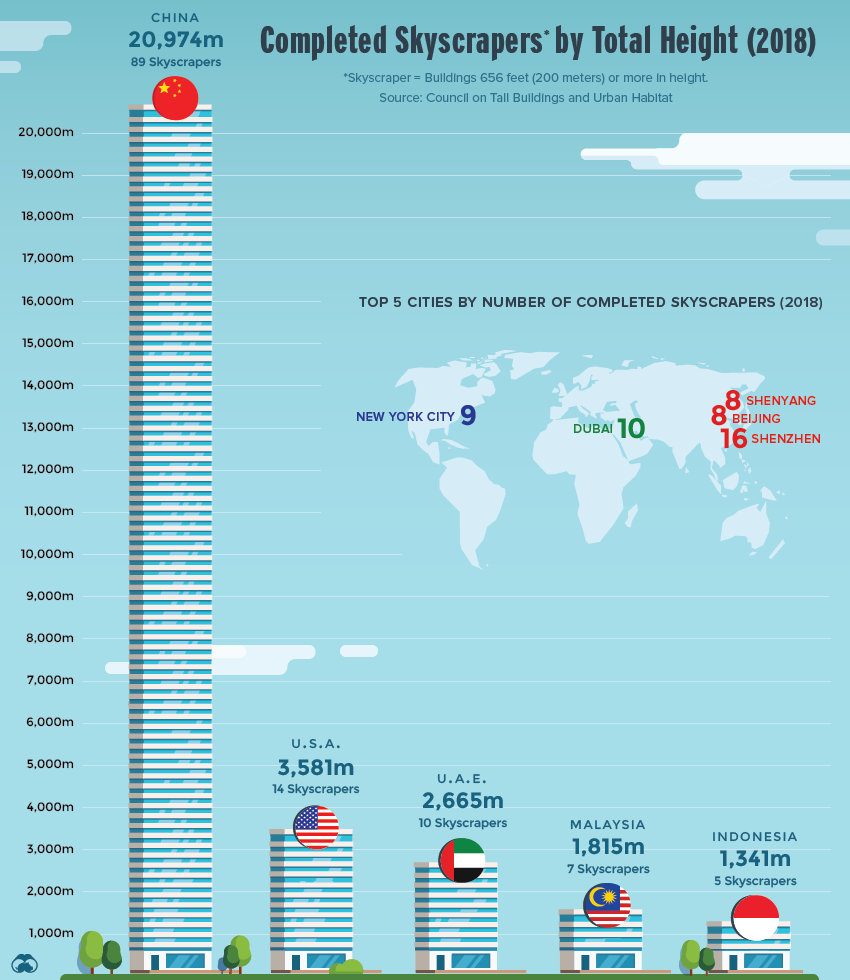
Where are the most skyscrapers popping up? Let’s take a look at regional hot-spots around the world. Note: For the purposes of this article, “skyscraper” will refer to buildings 656 feet (200 meters) or more in height.
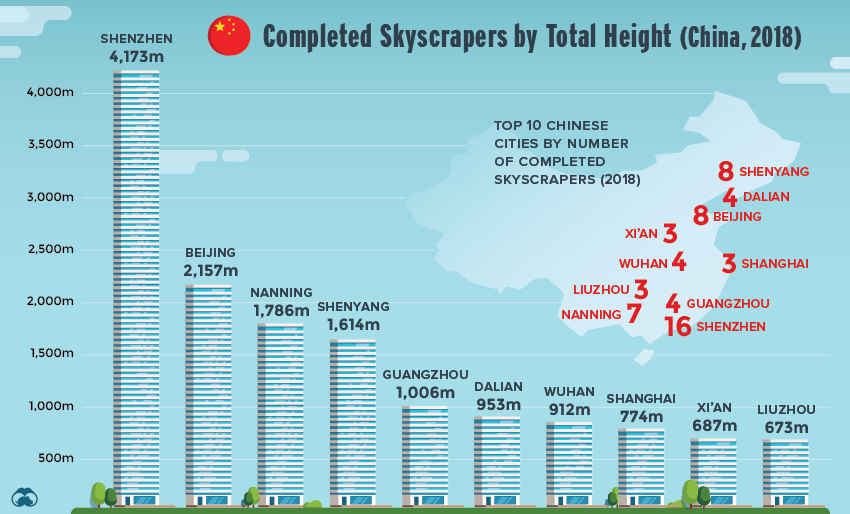
China is Flying High
For well over two decades, China has led the world in skyscraper construction, and 2018 was no exception. The country’s fixation on urban growth and continued economic success is producing tall buildings at a staggering rate. Last year, a mind-boggling 89 skyscrapers were completed in 28 different cities around China. To put this building boom into perspective, China completed more skyscrapers in one year than New York City’s entire stock of 656ft and taller buildings.
In 2018, no city reached for the stars quite like Shenzhen. The city, which is a hub of China’s high-flying tech sector, now has the second-most skyscrapers in the world, surpassed only by Dubai. Shenzhen isn’t just building a lot of skyscrapers, it’s building extremely tall ones too. In 2017, for example, the ribbon was cut on the massive Ping An Finance Center, which is currently the 4th tallest building in the world. Last year alone, four new towers cracked the 1,000ft (300m) barrier.
Asia, Rising
While China’s scale is hard to beat, other cities in the region are also undergoing dramatic changes, particularly in Southeast Asia. Malaysia and Indonesia completed a combined 13 new skyscrapers, and the Vincom Landmark 81 was added to Ho Chi Minh City’s growing roster of unique skyscrapers. While there are two skyscrapers under construction in Japan – one in Tokyo and one in Yokohama – none of them were completed last year.
A New Era of American Skyscrapers
After a two-decade lull in skyscraper construction, the United States is embracing taller buildings again. Last year alone, the U.S. added 14 new skyscrapers into the mix, particularly in New York City, where construction cranes dot the horizon. In the past decade, NYC has added 25 new skyscrapers to its iconic skyline. This trend is showing no signs of slowing down. Between now and 2022, 44 skyscraper projects are expected to be completed in the United States, with the vast majority being built in the Big Apple. on Cities become “expensive” due to a variety of factors such as high demand for housing, a concentration of high-paying businesses and industries, and a high standard of living. Additionally, factors such as taxes, transportation costs, and availability of goods and services can also contribute to the overall cost of living in global cities. The infographic above uses data from EIU to rank the world most and least expensive cities to live in. To make the list, the EIU examines 400+ prices for over 200 products and services in 172 cities, surveying a variety of businesses to track price fluctuations over the last year.
Inflation + Strong Currency = Expensive Cities
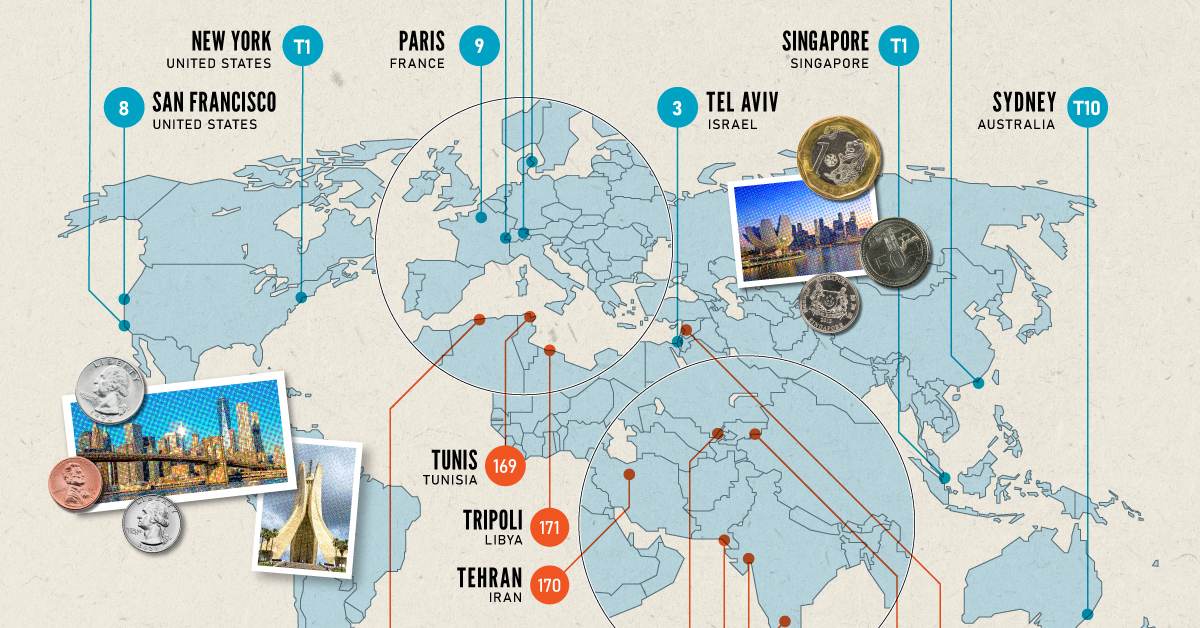
If you live in a city where many residents find it challenging to put a roof over their heads, food on their plates, and make ends meet, you live in an expensive city. But if this inflation is compounded with a strong national currency, you may live in one of the world’s most expensive cities. Singapore and New York City tied for the first rank amongst the world’s most expensive cities in 2022, pushing Israel’s Tel Aviv from the first place in 2021 to the third place in 2022. Both these cities had high inflation and a strong currency. Surprisingly, this is the Big Apple’s first time atop the ranking. The city with one of the most expensive real estate markets worldwide, Hong Kong ranked fourth in this list, followed by Los Angeles, which moved up from its ninth rank in 2021.
Poor Economies = Cheaper Cities
Asia continues to dominate the list of the world’s least expensive cities, followed by parts of North Africa and the Middle East. Though affordability sounds good at face value, sitting at the bottom of the ranking isn’t necessarily a coveted position. While the cost of living in some of the cities in these nations is low, it comes at the price of a weak currency, poor economy, and, in many cases, political and economic turmoil. The decade-long conflict in Syria weakened the Syrian pound, led to a spiraling inflation and fuel shortages, and further collapsed its economy. It’s no surprise that its capital city of Damascus has maintained its position as the world’s cheapest city. Tripoli and Tehran, the capitals of Libya and Iran, respectively, follow next on this list, reflecting their weakened economies. Meanwhile, seven cities in Asia with the common denominator of high-income inequality and low wages dominate the list of the world’s cheapest cities. These include three Indian cities, Tashkent in Uzbekistan, Almaty in Kazakhstan, Pakistan’s most populous city of Karachi, and Sri Lankan capital–Colombo.