Using insights from the American Time Use Survey and Our World in Data, we look at who Americans spend the most time with at various ages of their life.
Adolescence to Adulthood
In the average American’s teenage years, they spend most of their time alone and with their family. This makes sense, as the majority of people under 18 still live in a home with their nuclear family unit, meaning parents and siblings. Not surprisingly, adolescence is also when time spent with friends reaches its peak. Jumping forward to a person’s early adulthood, 25-year-olds spend an average of 275 minutes per day alone, and 199 minutes with coworkers. This aligns with people in their twenties beginning to enter the workforce. By age 35, people are still spending the most time with themselves, at 263 minutes per day. However, time spent combined with children and partners, the runner-ups, adds up to 450 minutes or around 7.5 hours a day. Although people are spending more time with kids and partners as they grow older, this trend may shift, as women are having fewer children. More women today are obtaining an education and are entering the workforce, causing them to delay or entirely put off having children.
Middle to Old Age
Upon turning 45, the average person spends 309 minutes a day alone, and in second place, 199 minutes with children. Time with coworkers remains relatively steady throughout someone’s forties, which coincides with the middle of career for most people in the workforce. By age 55, time spent alone still takes top spot, but time spent with a partner goes up to 184 minutes, and time with coworkers also moves up, pushing out time spent with children. Typically, time spent with children during the mid-fifties tends to see a sharp decline as children enter adulthood and begin to move out or spend more time out of the house. Today, more children are staying at home longer or even moving back home. 52% of adult children in the U.S. today are living with their parents. As people get closer to old age, around 65-years-old, they spend increasingly less time with coworkers as they begin to retire, and much more time alone or with a spouse. Then, from age 65-75, people consistently spend the most time alone, then with a partner and family.
Alone and Lonely?
One of the most significant trends on the chart is increased time spent alone.
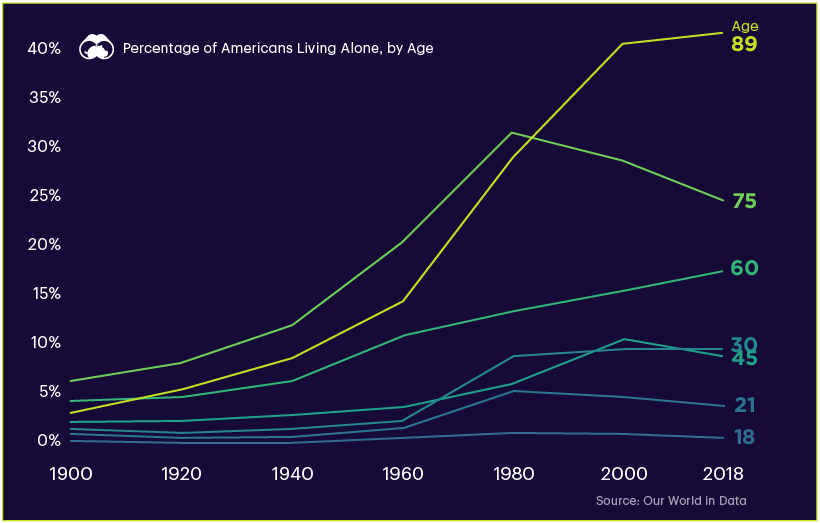
By the time someone reaches 80, their daily minutes alone goes up to 477. This can be a problematic reality. As the population continues to age in many countries around the world, more elderly people are left without resources or social connection. Additionally, while one quarter of elderly Americans live alone, the trend of solo living is going up across nearly every age group, and this trend applies to a number of mature economies around the world.
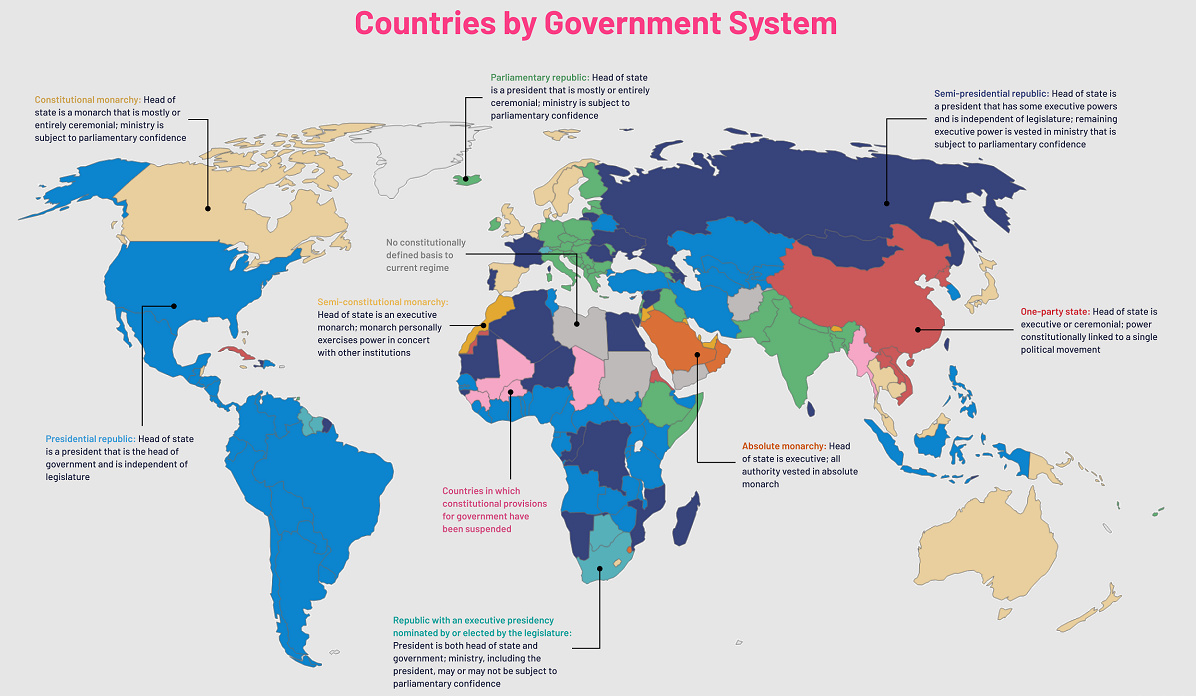
A natural conclusion would be that increasing alone time has negative impacts on people, however, being alone does not necessarily equate to loneliness. Our World in Data found that there was no direct correlation between living alone and reported feelings of loneliness. One final consideration is the role technology plays in our social interactions. Thanks to smartphones and social platforms, time alone doesn’t necessarily equal isolation. It is not just the amount of time spent with others, but the quality and expectations, that reduce loneliness. Source: U.S. Bureau of Labor Statistics American Time Use Survey, accessed on Our World in Data. Notes: While respondents to the Time Use Survey are tracking their activity, they indicate who was present during each activity recorded. This results in the data used in this article. It’s worth noting that individuals can be counted twice, since people from various categories can be present at the same time. on Even while political regimes across these countries have changed over time, they’ve largely followed a few different types of governance. Today, every country can ultimately be classified into just nine broad forms of government systems. This map by Truman Du uses information from Wikipedia to map the government systems that rule the world today.
Countries By Type of Government
It’s important to note that this map charts government systems according to each country’s legal framework. Many countries have constitutions stating their de jure or legally recognized system of government, but their de facto or realized form of governance may be quite different. Here is a list of the stated government system of UN member states and observers as of January 2023: Let’s take a closer look at some of these systems.
Monarchies
Brought back into the spotlight after the death of Queen Elizabeth II of England in September 2022, this form of government has a single ruler. They carry titles from king and queen to sultan or emperor, and their government systems can be further divided into three modern types: constitutional, semi-constitutional, and absolute. A constitutional monarchy sees the monarch act as head of state within the parameters of a constitution, giving them little to no real power. For example, King Charles III is the head of 15 Commonwealth nations including Canada and Australia. However, each has their own head of government. On the other hand, a semi-constitutional monarchy lets the monarch or ruling royal family retain substantial political powers, as is the case in Jordan and Morocco. However, their monarchs still rule the country according to a democratic constitution and in concert with other institutions. Finally, an absolute monarchy is most like the monarchies of old, where the ruler has full power over governance, with modern examples including Saudi Arabia and Vatican City.
Republics
Unlike monarchies, the people hold the power in a republic government system, directly electing representatives to form government. Again, there are multiple types of modern republic governments: presidential, semi-presidential, and parliamentary. The presidential republic could be considered a direct progression from monarchies. This system has a strong and independent chief executive with extensive powers when it comes to domestic affairs and foreign policy. An example of this is the United States, where the President is both the head of state and the head of government. In a semi-presidential republic, the president is the head of state and has some executive powers that are independent of the legislature. However, the prime minister (or chancellor or equivalent title) is the head of government, responsible to the legislature along with the cabinet. Russia is a classic example of this type of government. The last type of republic system is parliamentary. In this system, the president is a figurehead, while the head of government holds real power and is validated by and accountable to the parliament. This type of system can be seen in Germany, Italy, and India and is akin to constitutional monarchies. It’s also important to point out that some parliamentary republic systems operate slightly differently. For example in South Africa, the president is both the head of state and government, but is elected directly by the legislature. This leaves them (and their ministries) potentially subject to parliamentary confidence.
One-Party State
Many of the systems above involve multiple political parties vying to rule and govern their respective countries. In a one-party state, also called a single-party state or single-party system, only one political party has the right to form government. All other political parties are either outlawed or only allowed limited participation in elections. In this system, a country’s head of state and head of government can be executive or ceremonial but political power is constitutionally linked to a single political movement. China is the most well-known example of this government system, with the General Secretary of the Communist Party of China ruling as the de facto leader since 1989.
Provisional
The final form of government is a provisional government formed as an interim or transitional government. In this system, an emergency governmental body is created to manage political transitions after the collapse of a government, or when a new state is formed. Often these evolve into fully constitutionalized systems, but sometimes they hold power for longer than expected. Some examples of countries that are considered provisional include Libya, Burkina Faso, and Chad.


title: “Visualized Who Americans Spend Their Time With” ShowToc: true date: “2023-02-14” author: “Eloise Fox”
Using insights from the American Time Use Survey and Our World in Data, we look at who Americans spend the most time with at various ages of their life.
Adolescence to Adulthood
In the average American’s teenage years, they spend most of their time alone and with their family. This makes sense, as the majority of people under 18 still live in a home with their nuclear family unit, meaning parents and siblings. Not surprisingly, adolescence is also when time spent with friends reaches its peak. Jumping forward to a person’s early adulthood, 25-year-olds spend an average of 275 minutes per day alone, and 199 minutes with coworkers. This aligns with people in their twenties beginning to enter the workforce. By age 35, people are still spending the most time with themselves, at 263 minutes per day. However, time spent combined with children and partners, the runner-ups, adds up to 450 minutes or around 7.5 hours a day. Although people are spending more time with kids and partners as they grow older, this trend may shift, as women are having fewer children. More women today are obtaining an education and are entering the workforce, causing them to delay or entirely put off having children.
Middle to Old Age
Upon turning 45, the average person spends 309 minutes a day alone, and in second place, 199 minutes with children. Time with coworkers remains relatively steady throughout someone’s forties, which coincides with the middle of career for most people in the workforce. By age 55, time spent alone still takes top spot, but time spent with a partner goes up to 184 minutes, and time with coworkers also moves up, pushing out time spent with children. Typically, time spent with children during the mid-fifties tends to see a sharp decline as children enter adulthood and begin to move out or spend more time out of the house. Today, more children are staying at home longer or even moving back home. 52% of adult children in the U.S. today are living with their parents. As people get closer to old age, around 65-years-old, they spend increasingly less time with coworkers as they begin to retire, and much more time alone or with a spouse. Then, from age 65-75, people consistently spend the most time alone, then with a partner and family.
Alone and Lonely?
One of the most significant trends on the chart is increased time spent alone.
By the time someone reaches 80, their daily minutes alone goes up to 477. This can be a problematic reality. As the population continues to age in many countries around the world, more elderly people are left without resources or social connection. Additionally, while one quarter of elderly Americans live alone, the trend of solo living is going up across nearly every age group, and this trend applies to a number of mature economies around the world.
A natural conclusion would be that increasing alone time has negative impacts on people, however, being alone does not necessarily equate to loneliness. Our World in Data found that there was no direct correlation between living alone and reported feelings of loneliness. One final consideration is the role technology plays in our social interactions. Thanks to smartphones and social platforms, time alone doesn’t necessarily equal isolation. It is not just the amount of time spent with others, but the quality and expectations, that reduce loneliness. Source: U.S. Bureau of Labor Statistics American Time Use Survey, accessed on Our World in Data. Notes: While respondents to the Time Use Survey are tracking their activity, they indicate who was present during each activity recorded. This results in the data used in this article. It’s worth noting that individuals can be counted twice, since people from various categories can be present at the same time. on Even while political regimes across these countries have changed over time, they’ve largely followed a few different types of governance. Today, every country can ultimately be classified into just nine broad forms of government systems. This map by Truman Du uses information from Wikipedia to map the government systems that rule the world today.
Countries By Type of Government
It’s important to note that this map charts government systems according to each country’s legal framework. Many countries have constitutions stating their de jure or legally recognized system of government, but their de facto or realized form of governance may be quite different. Here is a list of the stated government system of UN member states and observers as of January 2023: Let’s take a closer look at some of these systems.
Monarchies
Brought back into the spotlight after the death of Queen Elizabeth II of England in September 2022, this form of government has a single ruler. They carry titles from king and queen to sultan or emperor, and their government systems can be further divided into three modern types: constitutional, semi-constitutional, and absolute. A constitutional monarchy sees the monarch act as head of state within the parameters of a constitution, giving them little to no real power. For example, King Charles III is the head of 15 Commonwealth nations including Canada and Australia. However, each has their own head of government. On the other hand, a semi-constitutional monarchy lets the monarch or ruling royal family retain substantial political powers, as is the case in Jordan and Morocco. However, their monarchs still rule the country according to a democratic constitution and in concert with other institutions. Finally, an absolute monarchy is most like the monarchies of old, where the ruler has full power over governance, with modern examples including Saudi Arabia and Vatican City.
Republics
Unlike monarchies, the people hold the power in a republic government system, directly electing representatives to form government. Again, there are multiple types of modern republic governments: presidential, semi-presidential, and parliamentary. The presidential republic could be considered a direct progression from monarchies. This system has a strong and independent chief executive with extensive powers when it comes to domestic affairs and foreign policy. An example of this is the United States, where the President is both the head of state and the head of government. In a semi-presidential republic, the president is the head of state and has some executive powers that are independent of the legislature. However, the prime minister (or chancellor or equivalent title) is the head of government, responsible to the legislature along with the cabinet. Russia is a classic example of this type of government. The last type of republic system is parliamentary. In this system, the president is a figurehead, while the head of government holds real power and is validated by and accountable to the parliament. This type of system can be seen in Germany, Italy, and India and is akin to constitutional monarchies. It’s also important to point out that some parliamentary republic systems operate slightly differently. For example in South Africa, the president is both the head of state and government, but is elected directly by the legislature. This leaves them (and their ministries) potentially subject to parliamentary confidence.
One-Party State
Many of the systems above involve multiple political parties vying to rule and govern their respective countries. In a one-party state, also called a single-party state or single-party system, only one political party has the right to form government. All other political parties are either outlawed or only allowed limited participation in elections. In this system, a country’s head of state and head of government can be executive or ceremonial but political power is constitutionally linked to a single political movement. China is the most well-known example of this government system, with the General Secretary of the Communist Party of China ruling as the de facto leader since 1989.
Provisional
The final form of government is a provisional government formed as an interim or transitional government. In this system, an emergency governmental body is created to manage political transitions after the collapse of a government, or when a new state is formed. Often these evolve into fully constitutionalized systems, but sometimes they hold power for longer than expected. Some examples of countries that are considered provisional include Libya, Burkina Faso, and Chad.


